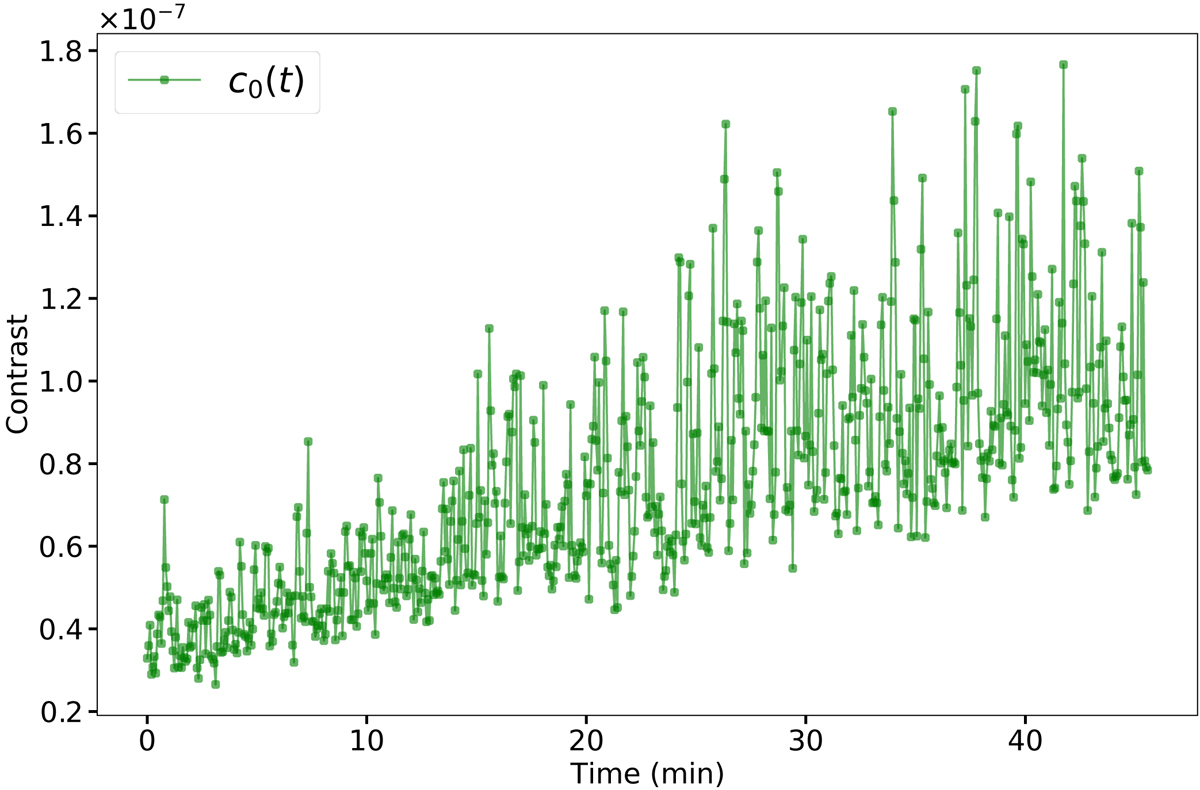
Fig. 5.
Download original image
Contrast c0(t) during the PASTIS matrix acquisition. After each pair-wise aberrated DH measurement, we flatten the IrisAO segmented DM to measure the drift in the coronagraph floor over the course of the experiment. We subtract this off our data in order to perform an analysis on the differential contrast, Δc. This open-loop contrast degrades gradually over time (note the linear scale). The measured contrast values range from 2.5 × 10⁻⁸ to 8 × 10⁻⁸ during the course of the experiment, but the difference between adjacent measurements is initially on the order of 2 × 10⁻⁸, rising to 1 × 10⁻⁷ later on, which is sufficient for our proposed calibration method. The total duration of the experiment is 45 min.
Current usage metrics show cumulative count of Article Views (full-text article views including HTML views, PDF and ePub downloads, according to the available data) and Abstracts Views on Vision4Press platform.
Data correspond to usage on the plateform after 2015. The current usage metrics is available 48-96 hours after online publication and is updated daily on week days.
Initial download of the metrics may take a while.