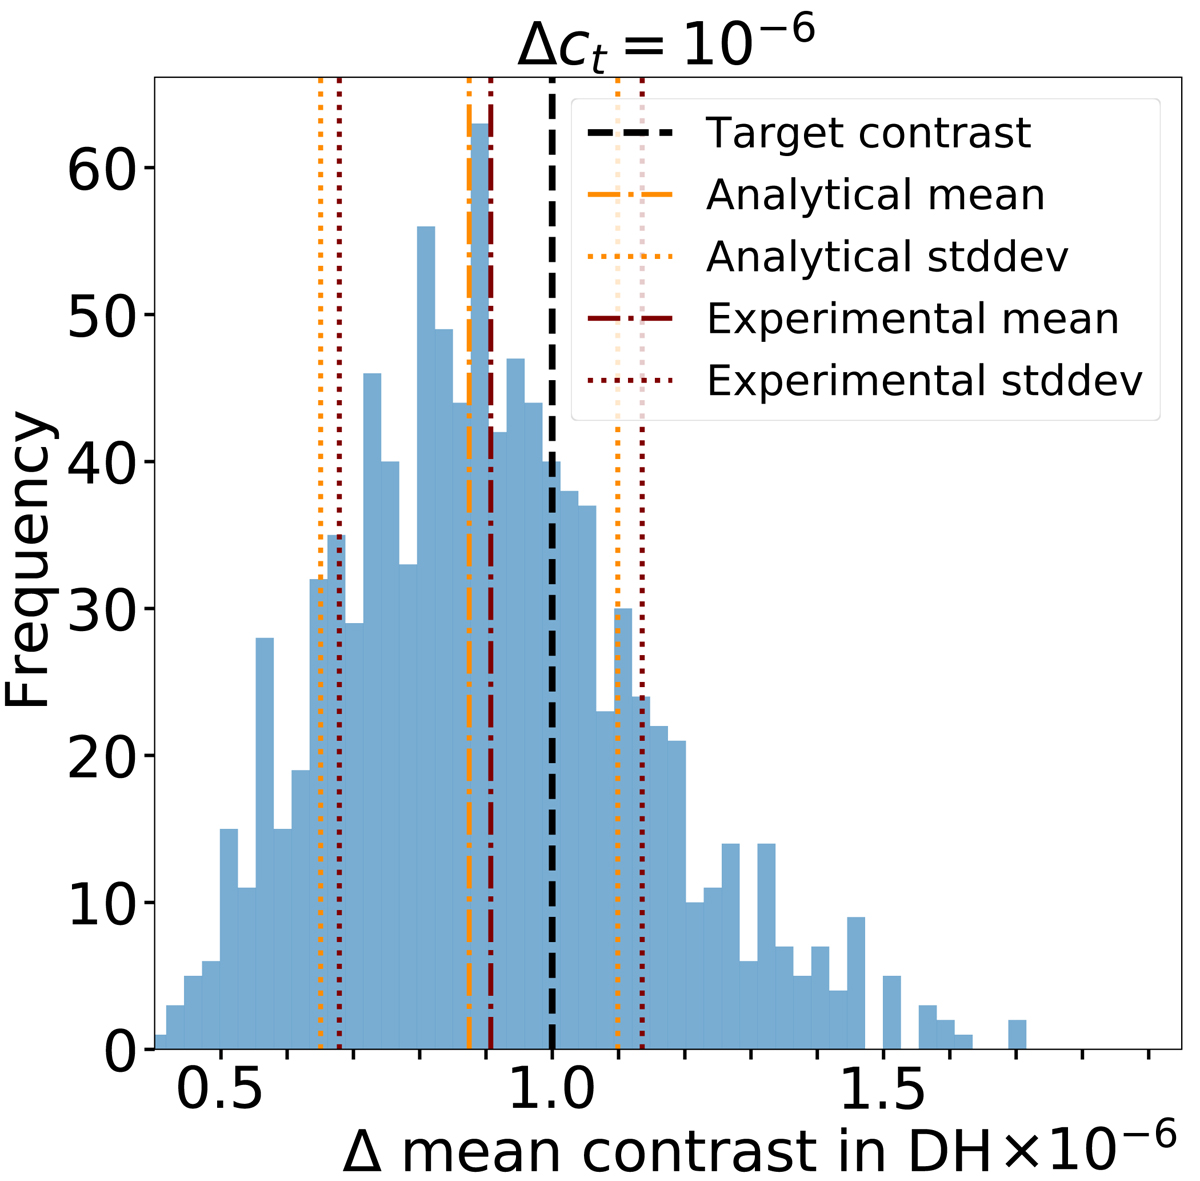
Fig. 14.
Download original image
Monte Carlo experiment on HiCAT for segment tolerances obtained from the simulated PASTIS matrix diagonal using Eq. (12). The target contrast, Δct = 10−6, as determined by the simulated tolerances, is indicated with the dashed black line. The experimental mean over 1000 segmented WFE maps (dashed-dotted red line) does not recover the target contrast. However, we are able to predict this discrepancy analytically: Using Eqs. (8) and (9), we can calculate the resulting contrast mean (dashed-dotted orange line) and variance (dotted orange lines) from the experimental PASTIS matrix and simulated segment tolerances directly. For details, see the main text.
Current usage metrics show cumulative count of Article Views (full-text article views including HTML views, PDF and ePub downloads, according to the available data) and Abstracts Views on Vision4Press platform.
Data correspond to usage on the plateform after 2015. The current usage metrics is available 48-96 hours after online publication and is updated daily on week days.
Initial download of the metrics may take a while.