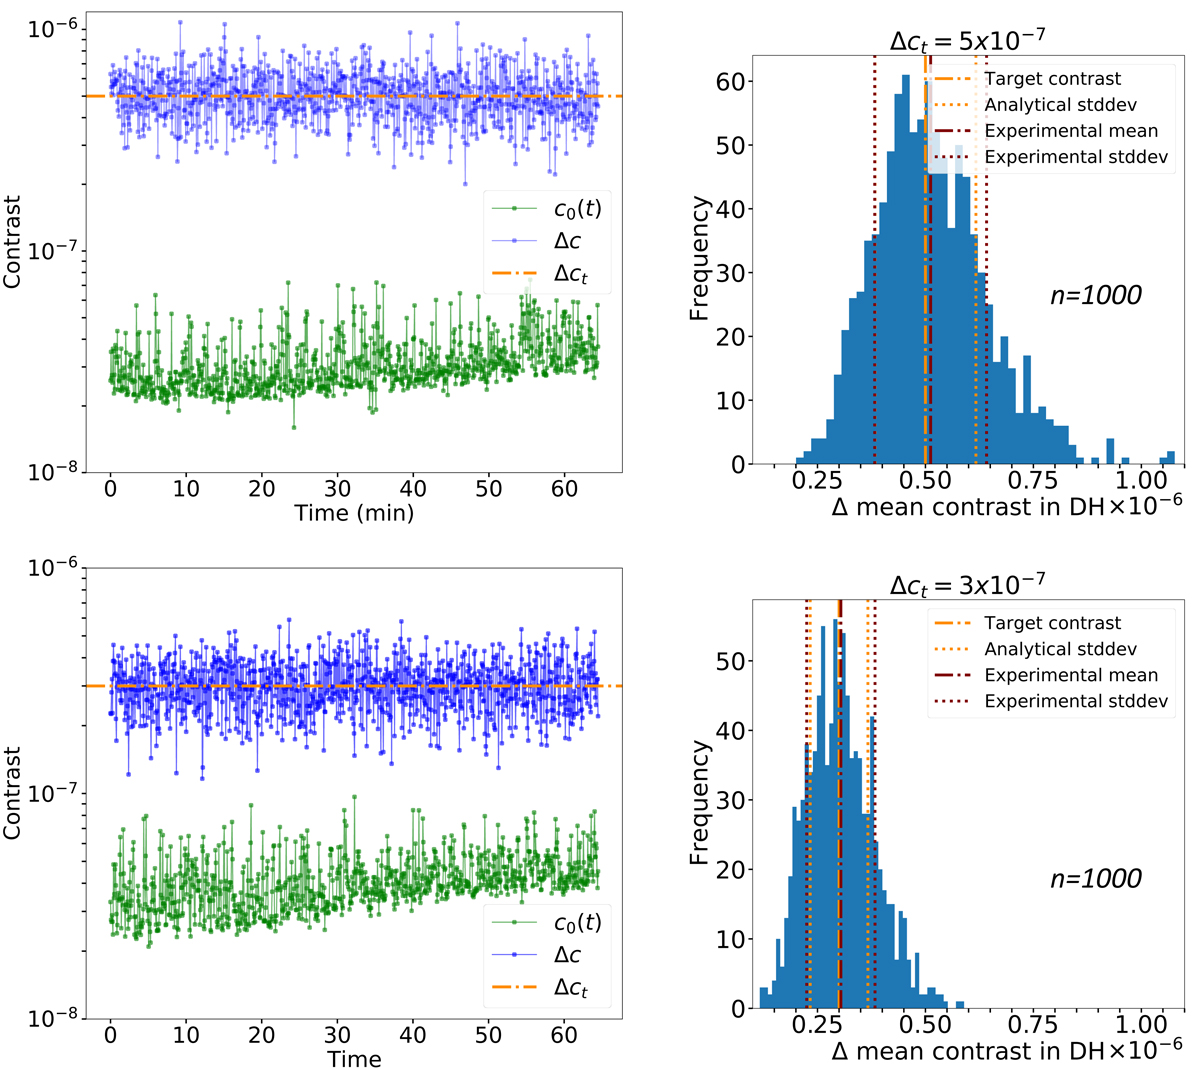
Fig. 13.
Download original image
Monte Carlo experiments on HiCAT to validate the independent segment error budget shown in Fig. 11, calculated from the experimental PASTIS matrix with Eq. (12) for target contrasts of Δct = 5 × 10⁻⁷ (top) and Δct = 3 × 10⁻⁷ (bottom). Left: time series of the measured random contrasts (blue), from which the intermittently measured un-aberrated contrast drift (green) has been subtracted. The total duration of each experiment is 65 min and captures 1000 randomly generated WFE maps. The target contrast of both experiments is indicated by the dashed orange lines. Right: contrast measurement from the random WFEs to the left, plotted as histograms. The experimental distributions have a mean (dashed-dotted red lines) of 5.12 × 10⁻⁷ (top) and 3.04 × 10⁻⁷ (bottom). The expected standard deviations (dotted orange lines) as calculated by Eq. (9) are 1.2 × 10⁻⁷ (top) and 6.7 × 10⁻⁸ (bottom), versus the experimentally measured standard deviations (dotted red lines) of 1.3 × 10⁻⁷ and 7.7 × 10⁻⁸.
Current usage metrics show cumulative count of Article Views (full-text article views including HTML views, PDF and ePub downloads, according to the available data) and Abstracts Views on Vision4Press platform.
Data correspond to usage on the plateform after 2015. The current usage metrics is available 48-96 hours after online publication and is updated daily on week days.
Initial download of the metrics may take a while.