Fig. 10.
Download original image
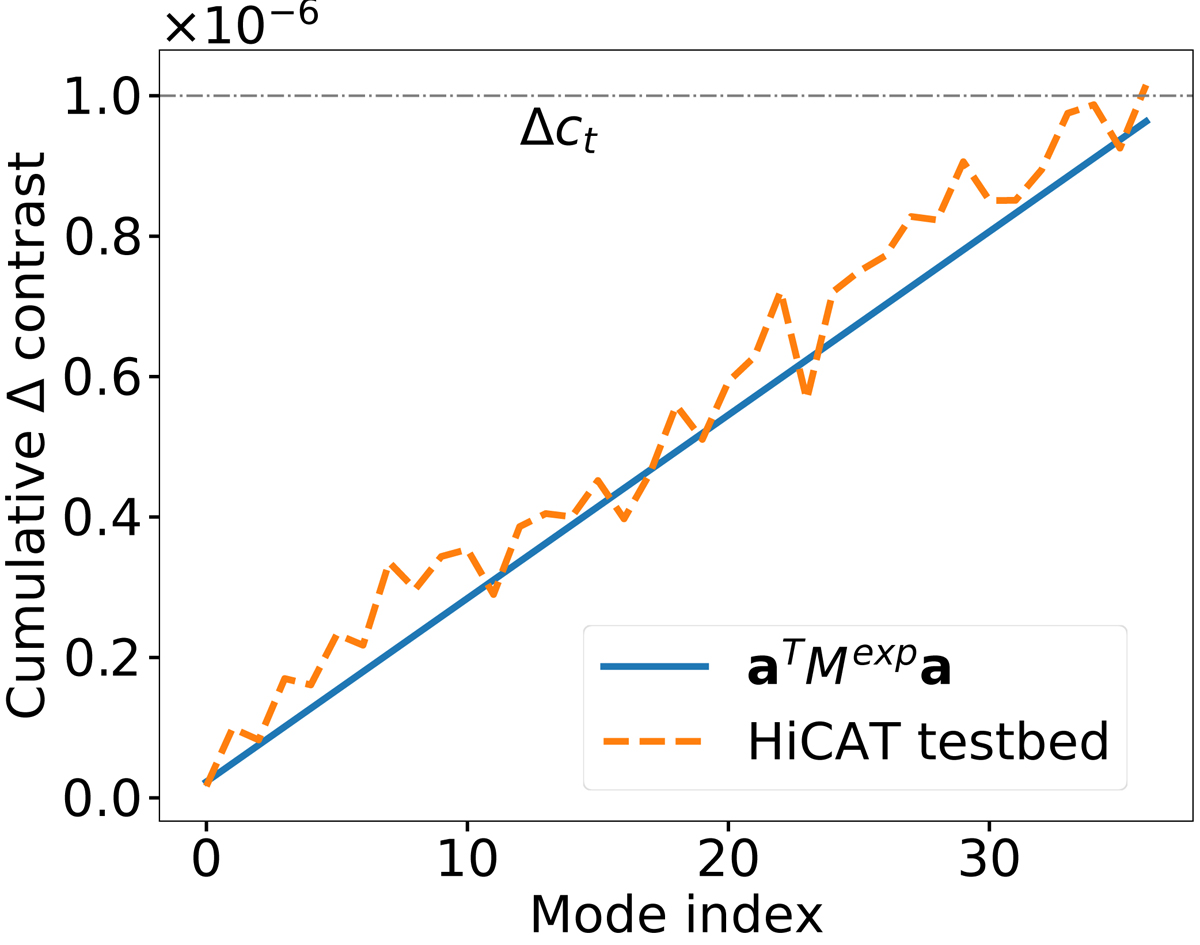
Cumulative contrast plot for the uniform mode requirements shown in Fig. 9, calculated both with the PASTIS forward model in Eq. (4) and with the experimental PASTIS matrix (solid blue) and measured on the HiCAT testbed (dashed orange). The analytical PASTIS calculation shows the perfect linear curve that the uniformly scaled modes would cause on an ideal testbed without noise or drifts. The testbed measurements show noisy behavior around the ideal curve, which is likely caused by segmented DM command uncertainties for small actuations and an insufficiently well-calibrated coronagraph floor.
Current usage metrics show cumulative count of Article Views (full-text article views including HTML views, PDF and ePub downloads, according to the available data) and Abstracts Views on Vision4Press platform.
Data correspond to usage on the plateform after 2015. The current usage metrics is available 48-96 hours after online publication and is updated daily on week days.
Initial download of the metrics may take a while.