Free Access
Fig. 8
Download original image
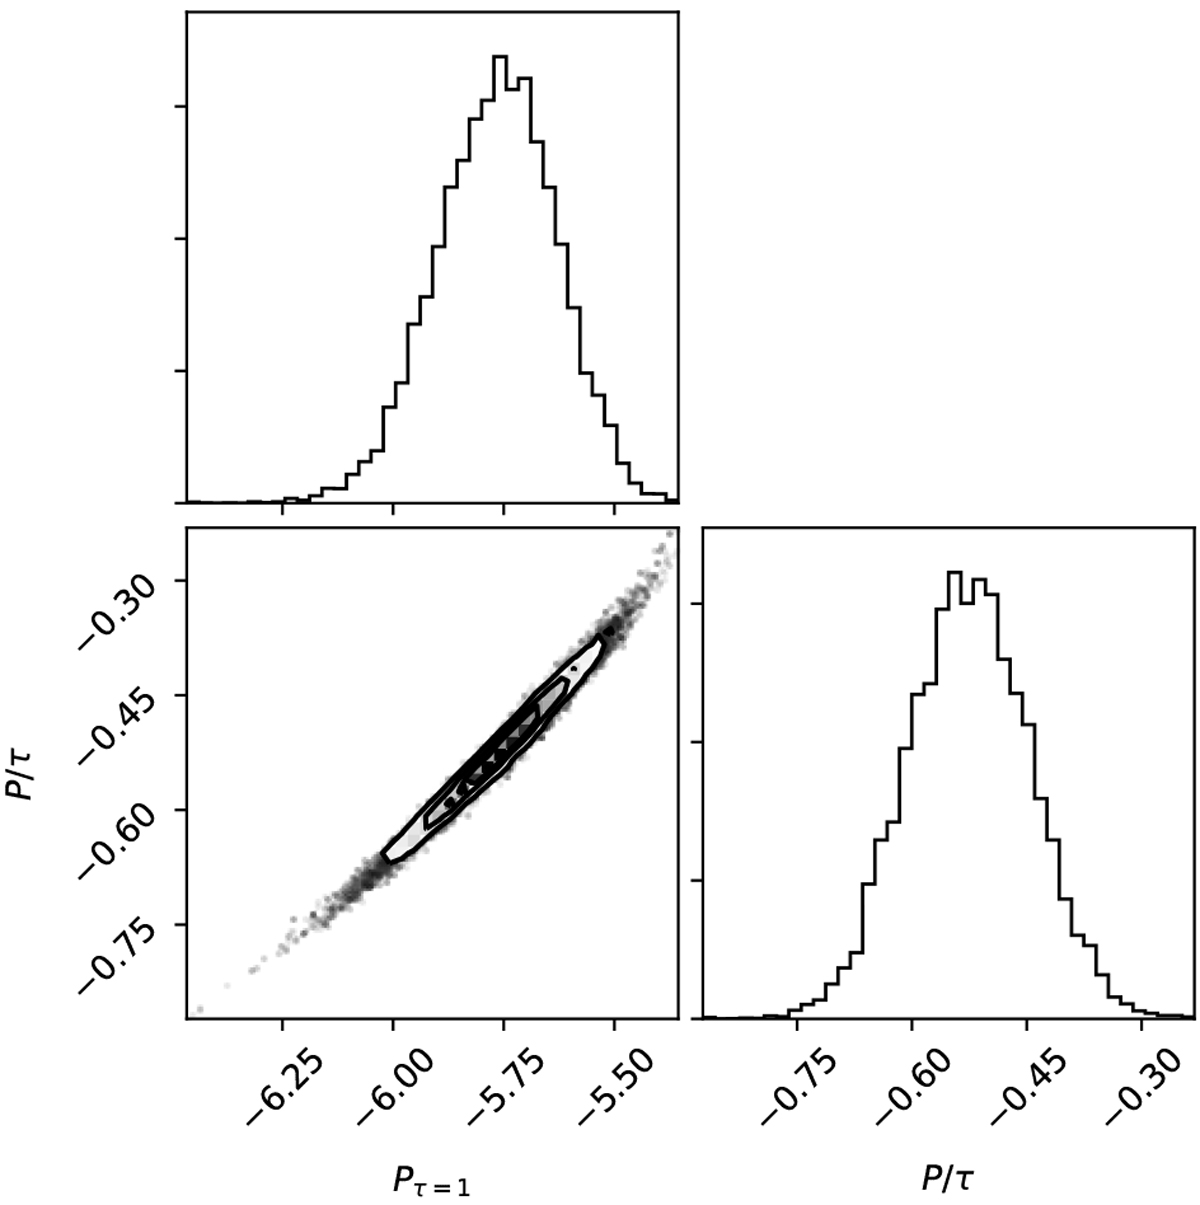
Posterior distributions of the model parameters for a linearly stratified P abundance from the MCMC analysis. Pτ=1 represents the abundance at τ5000 = 1, while P∕τ is the slope in abundance with logτ5000. The lower left panel indicates strong covariance between these parameters.
Current usage metrics show cumulative count of Article Views (full-text article views including HTML views, PDF and ePub downloads, according to the available data) and Abstracts Views on Vision4Press platform.
Data correspond to usage on the plateform after 2015. The current usage metrics is available 48-96 hours after online publication and is updated daily on week days.
Initial download of the metrics may take a while.