Fig. 4
Download original image
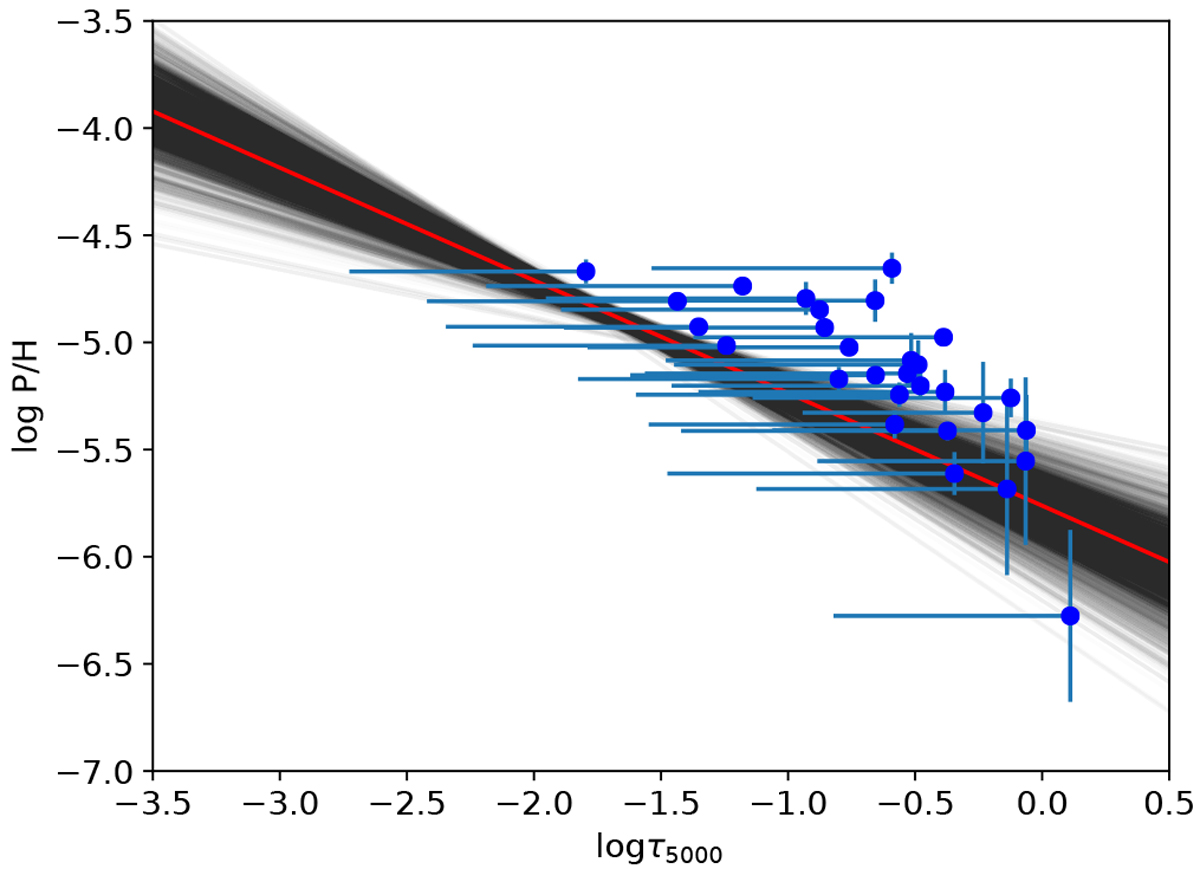
Abundance estimates of P as a function of optical depth (τ5000). Abundances for individual lines are shown as points where the optical depth in the line center reaches unity. The horizontal bar extends to where the optical depth in the line center is 0.1 to illustrate the range of depths relevant for line formation. Vertical errors are the statistical uncertainty on the abundance. The red line is the best (median) linear P distribution from directly fitting all observed P lines simultaneously. The light gray lines represent individual models from the Markov chain, with darker gray areas corresponding to a higher probability density.
Current usage metrics show cumulative count of Article Views (full-text article views including HTML views, PDF and ePub downloads, according to the available data) and Abstracts Views on Vision4Press platform.
Data correspond to usage on the plateform after 2015. The current usage metrics is available 48-96 hours after online publication and is updated daily on week days.
Initial download of the metrics may take a while.