Free Access
Fig. 3
Download original image
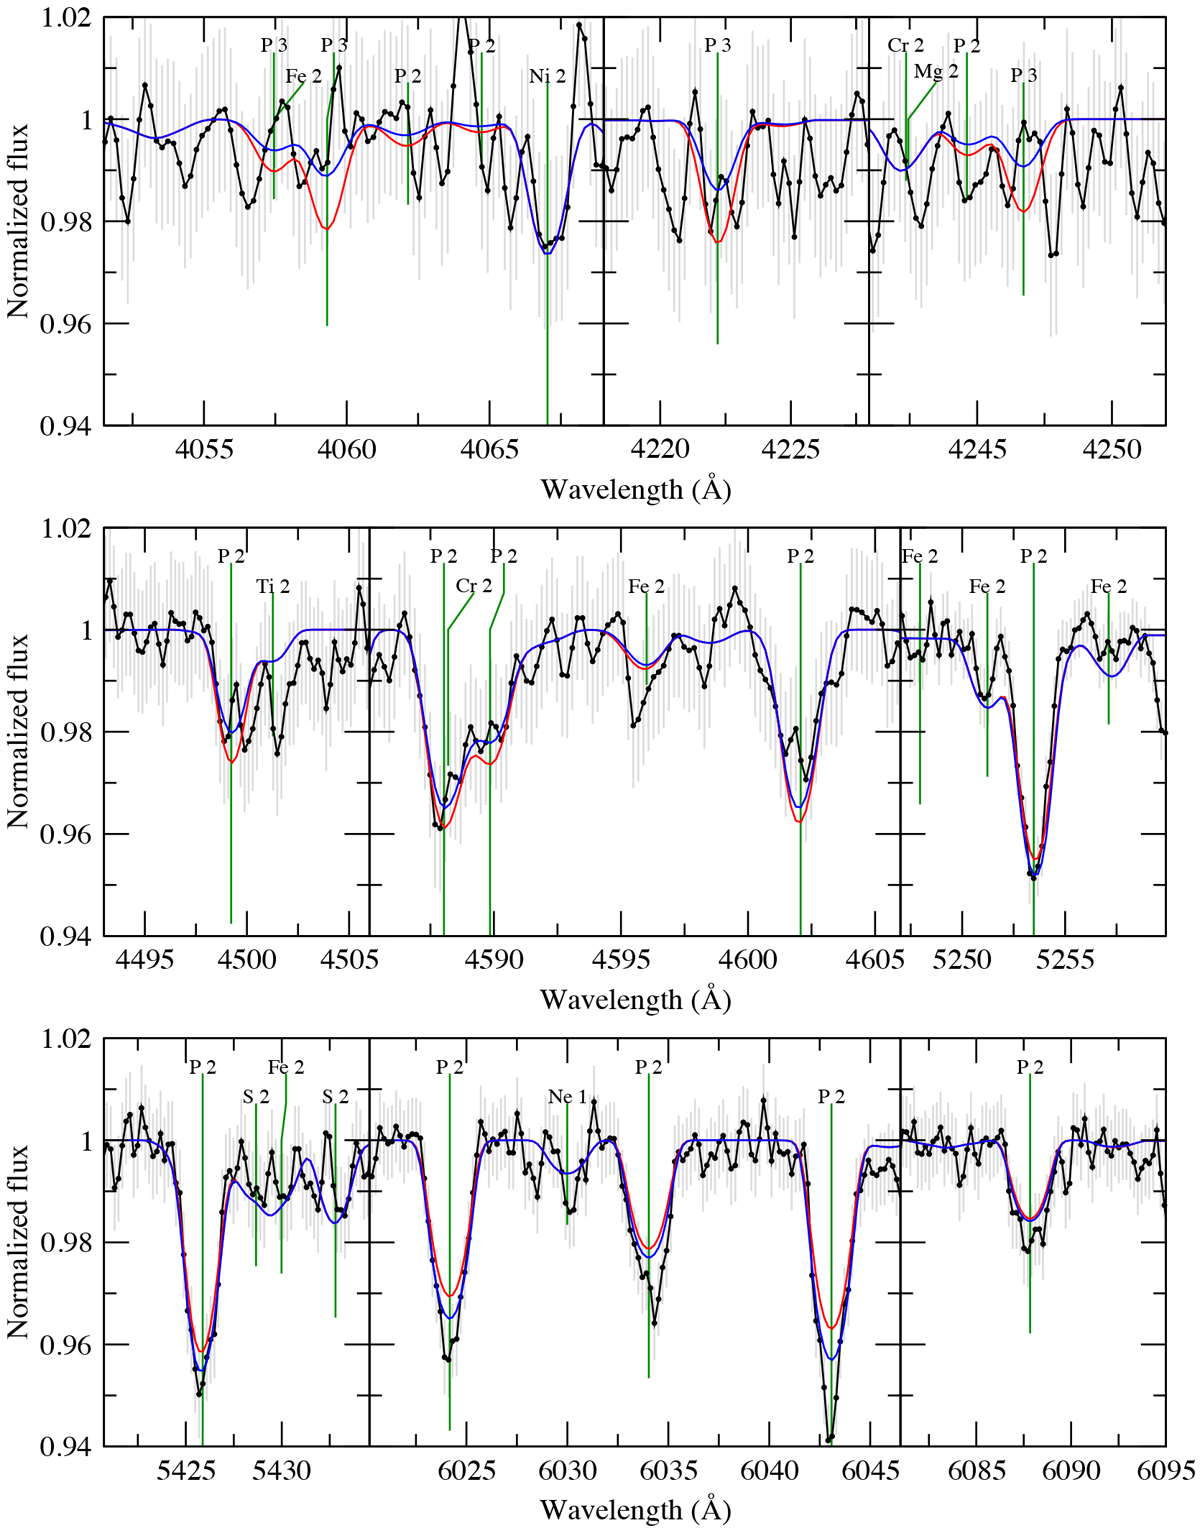
Selection of the P lines used for the stratification analysis. The observation is shown in black (error bars in light gray), the best-fit model with a vertically constant abundance is in red, and the best-fit model with a linear variation in the abundance with log optical depth is in blue.
Current usage metrics show cumulative count of Article Views (full-text article views including HTML views, PDF and ePub downloads, according to the available data) and Abstracts Views on Vision4Press platform.
Data correspond to usage on the plateform after 2015. The current usage metrics is available 48-96 hours after online publication and is updated daily on week days.
Initial download of the metrics may take a while.