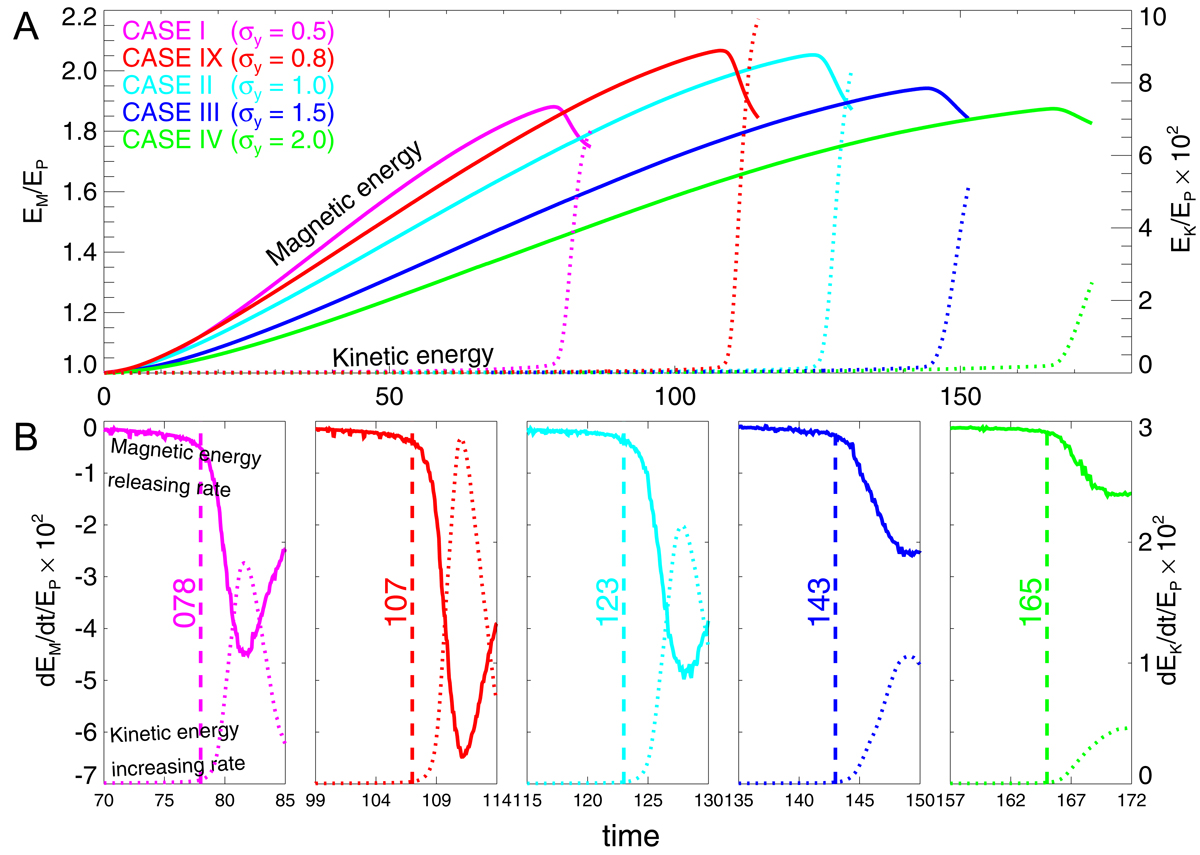
Fig. 8.
Download original image
Temporal evolution of magnetic energy and kinetic energy in the simulations of different σy. The color of the lines represents five experiments, magenta, red, cyan, blue, and green represent CASE I, IX, II, III, IV, respectively. A: evolution of magnetic energy EM (solid lines) and kinetic energy EK (dotted lines). B: releasing rate of magnetic energy and increasing rate of kinetic energy of five experiments. The vertical dashed lines are shown for denoting the transition time of from pre-eruption to eruption. In the ordinates of all panels, the normalized unit is the potential field energy based on each magnetogram.
Current usage metrics show cumulative count of Article Views (full-text article views including HTML views, PDF and ePub downloads, according to the available data) and Abstracts Views on Vision4Press platform.
Data correspond to usage on the plateform after 2015. The current usage metrics is available 48-96 hours after online publication and is updated daily on week days.
Initial download of the metrics may take a while.