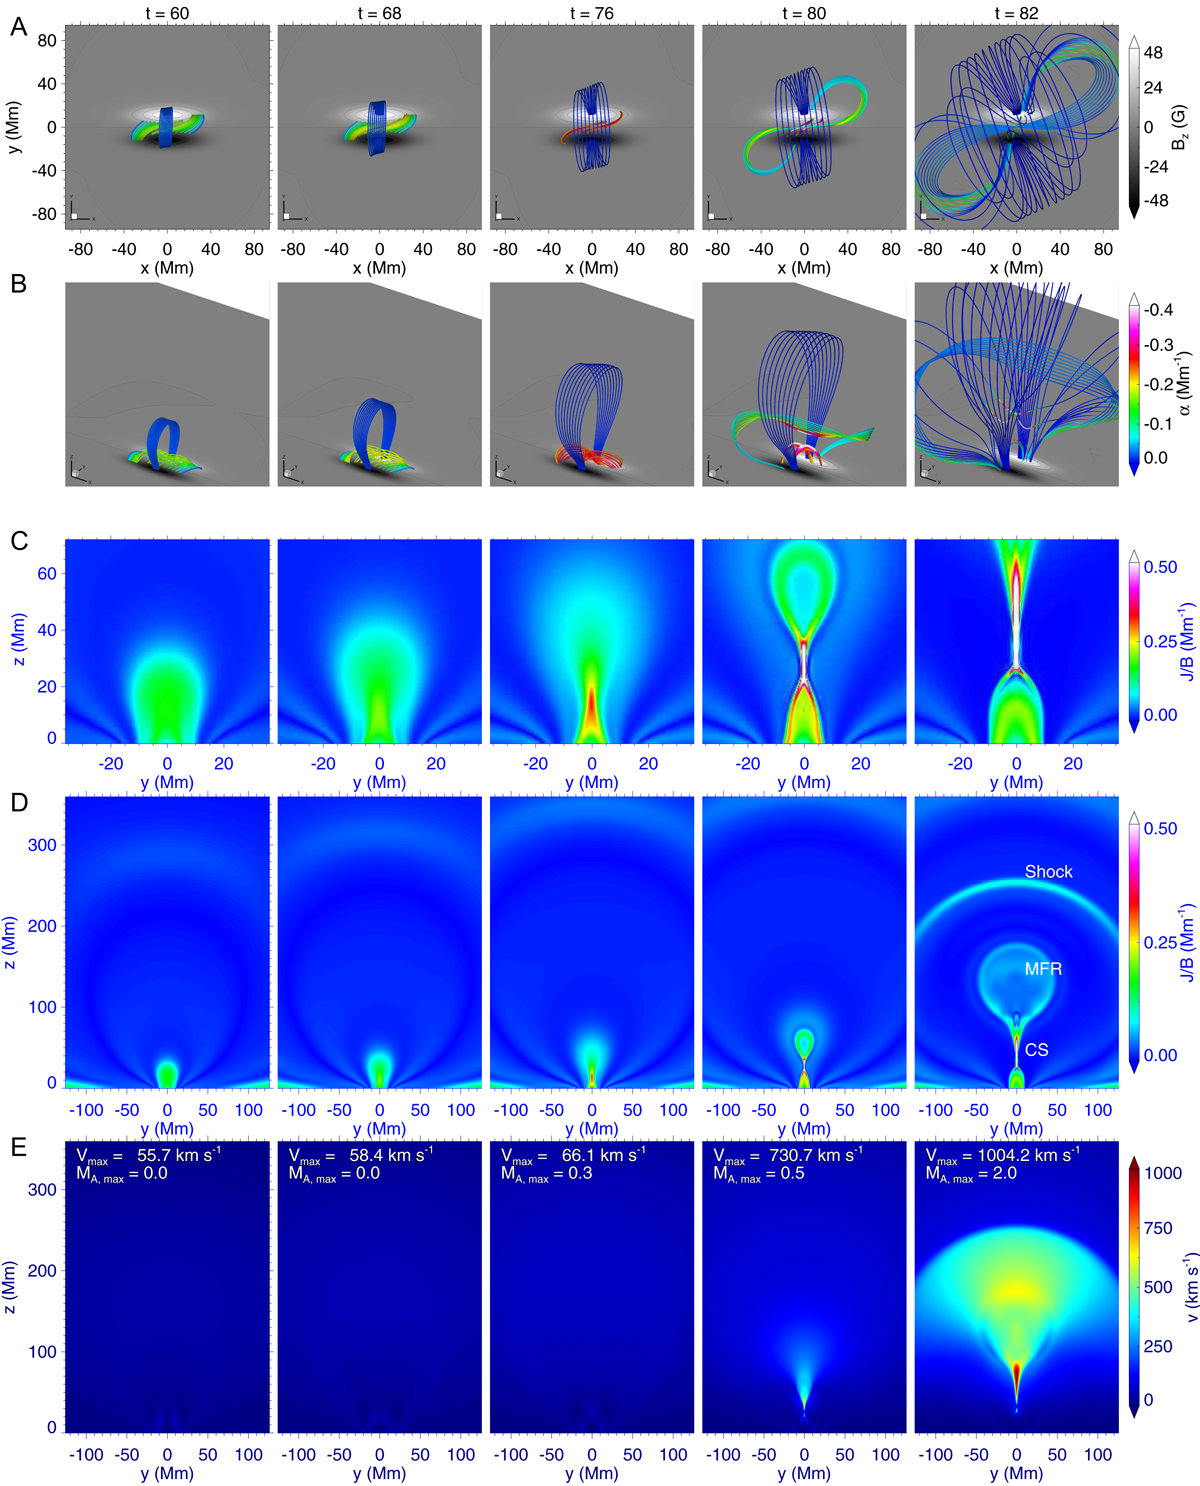
Fig. 7.
Download original image
Evolution of magnetic field lines, electric currents, and velocity in the whole simulation process of CASE I. A: top view of magnetic field lines. The colored thick lines represent magnetic field lines and the colors denote the value of nonlinear force-free factor defined as α = J ⋅ B/B2, which indicates the extent to which the field lines are of non-potential character. The background shows the magnetic flux distribution on the bottom boundary (i.e., plane of z = 0), and contours of Bz = ( − 48, −32, −16, 0, 16, 32, 48) G are shown. B: 3D prospective view of the same field lines shown in panel A. C: current density, J, normalized by magnetic field strength, B, in vertical cross section (i.e., the x = 0 slice). D: same as C, but with a large area. E: magnitudes of velocity. The largest velocity and Alfvénic Mach number are also denoted.
Current usage metrics show cumulative count of Article Views (full-text article views including HTML views, PDF and ePub downloads, according to the available data) and Abstracts Views on Vision4Press platform.
Data correspond to usage on the plateform after 2015. The current usage metrics is available 48-96 hours after online publication and is updated daily on week days.
Initial download of the metrics may take a while.