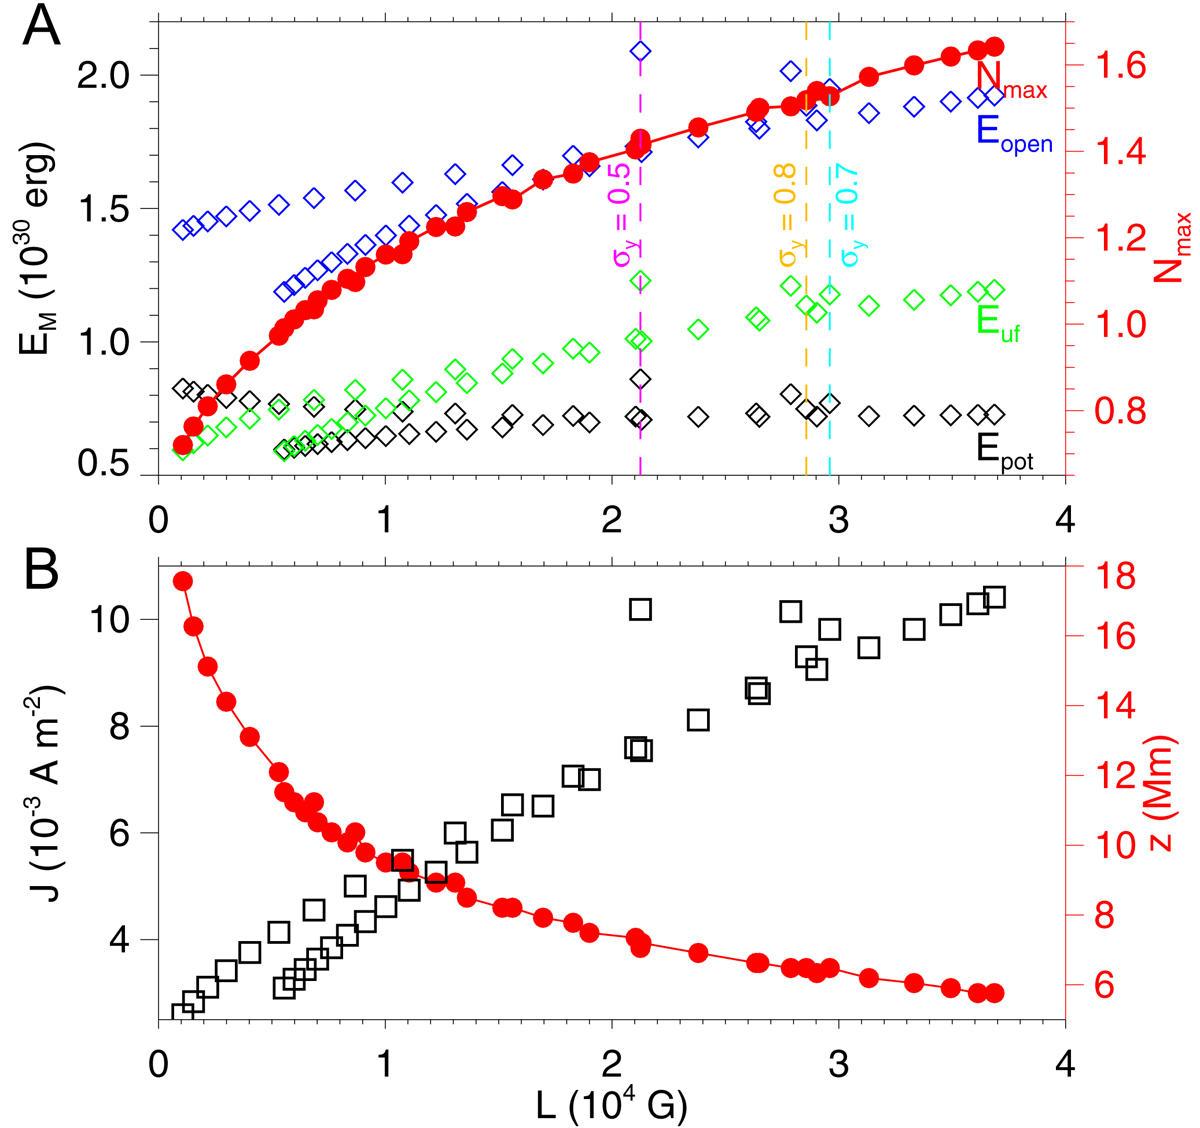
Fig. 6.
Download original image
Relationship between the non-potentiality Nmax and distribution of CS and the line integral of the Bz gradient across the PIL on the magnetogram. A: diamond represents magnetic energies, and black, blue, and green represent the potential energy, open field energy, and free magnetic energy, respectively. Red solid circle represents non-potentiality, Nmax. The three dashed vertical lines represent the values of three different parameters σy (with σx = 2.0 and yc = 0.8 fixed). Magenta, cyan, and gold represent σy = 0.5, 0.7, and 0.8, respectively. B: black squares represents the maximum current density and the red solid curves represents the height of the maximum current density.
Current usage metrics show cumulative count of Article Views (full-text article views including HTML views, PDF and ePub downloads, according to the available data) and Abstracts Views on Vision4Press platform.
Data correspond to usage on the plateform after 2015. The current usage metrics is available 48-96 hours after online publication and is updated daily on week days.
Initial download of the metrics may take a while.