Fig. 3.
Download original image
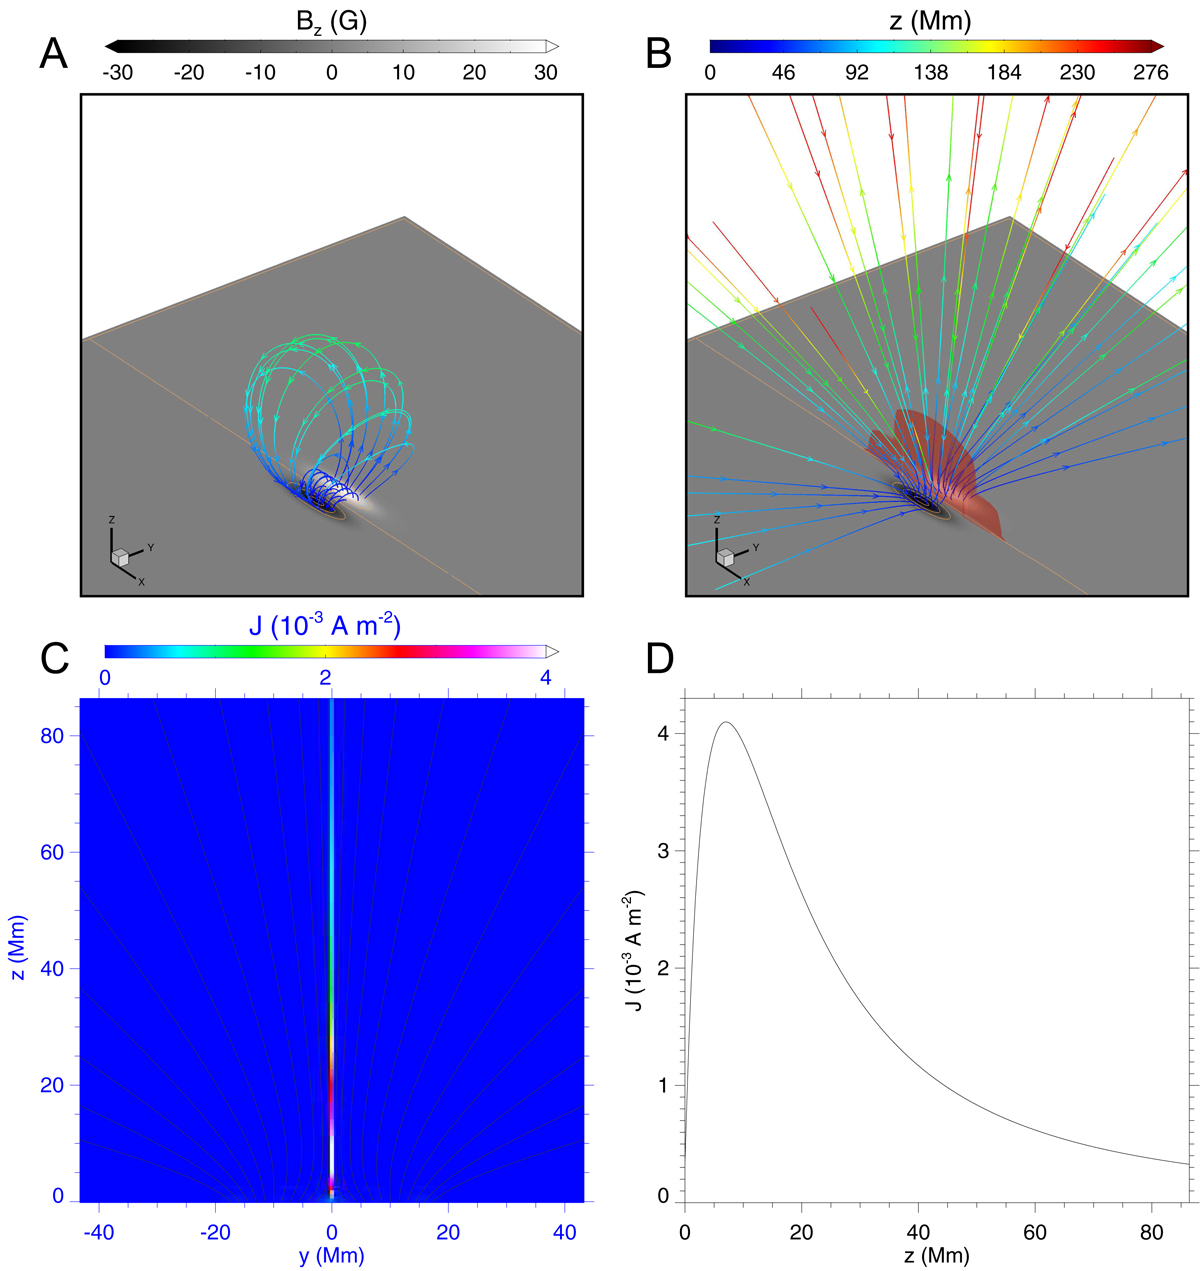
Potential field and the open field with the same magnetic flux distribution on the bottom surface, and the distribution of CS in the open field. A: 3D prospective view of the potential field lines. The colored thick lines represent magnetic field lines and the colors denote the height. The background shows the magnetic flux distribution on the bottom boundary. B: 3D prospective view of the fully opened field lines, with same footpoints shown in panel A. The red iso-surface represents the CS, whose current density is J = 0.34 × 10⁻³ A m−2. C: current distribution and magnetic field lines on the central cross section (i.e., the x = 0 plane). D: profile of current density along z axis. We note that here with finite grid resolution, the CS has a finite thickness of 360 km. Thus the current density is not infinite.
Current usage metrics show cumulative count of Article Views (full-text article views including HTML views, PDF and ePub downloads, according to the available data) and Abstracts Views on Vision4Press platform.
Data correspond to usage on the plateform after 2015. The current usage metrics is available 48-96 hours after online publication and is updated daily on week days.
Initial download of the metrics may take a while.