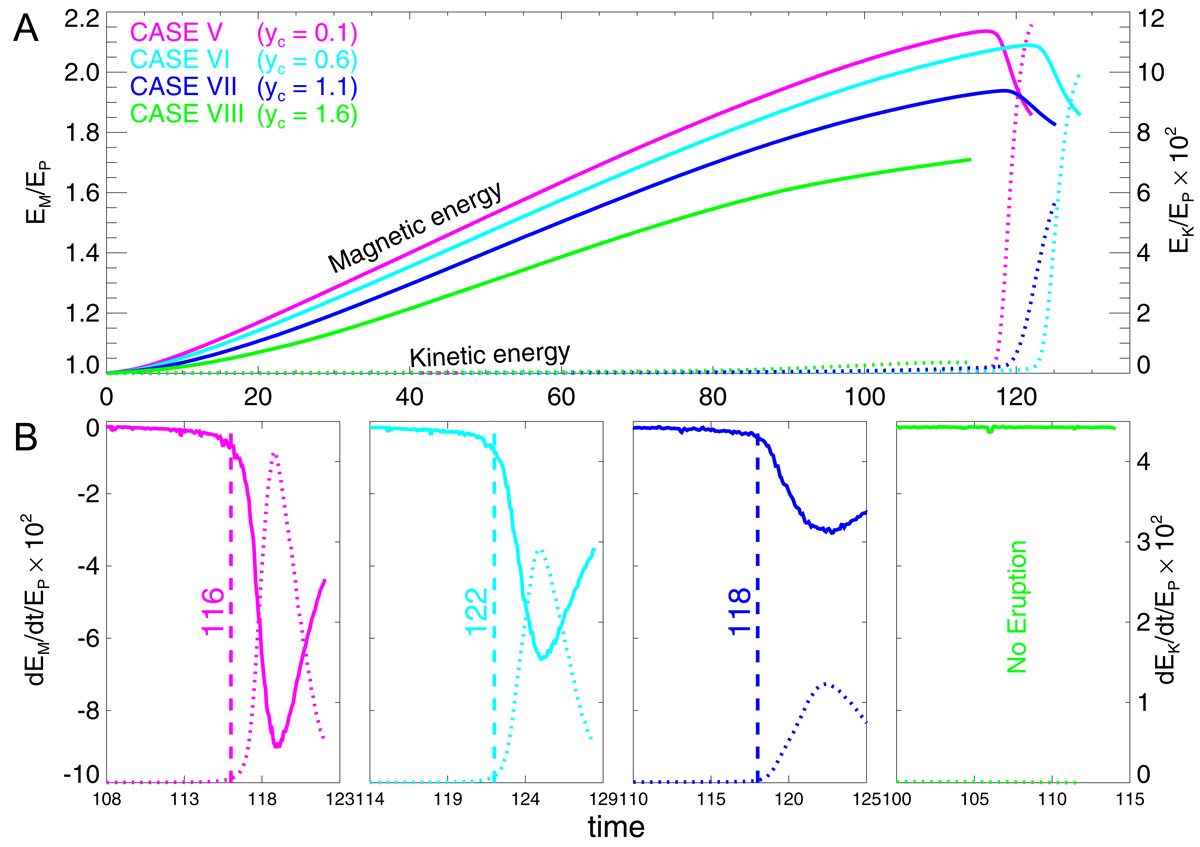
Fig. 10.
Download original image
Temporal evolution of magnetic energy and kinetic energy in the simulations of different yc. Same details as in Fig. 8 but with different yc. The color of the lines represents four experiments, magenta, cyan, blue, and green represent CASE V, VI, VII, and VIII, respectively. We note that CASE VIII did not produce an eruption.
Current usage metrics show cumulative count of Article Views (full-text article views including HTML views, PDF and ePub downloads, according to the available data) and Abstracts Views on Vision4Press platform.
Data correspond to usage on the plateform after 2015. The current usage metrics is available 48-96 hours after online publication and is updated daily on week days.
Initial download of the metrics may take a while.