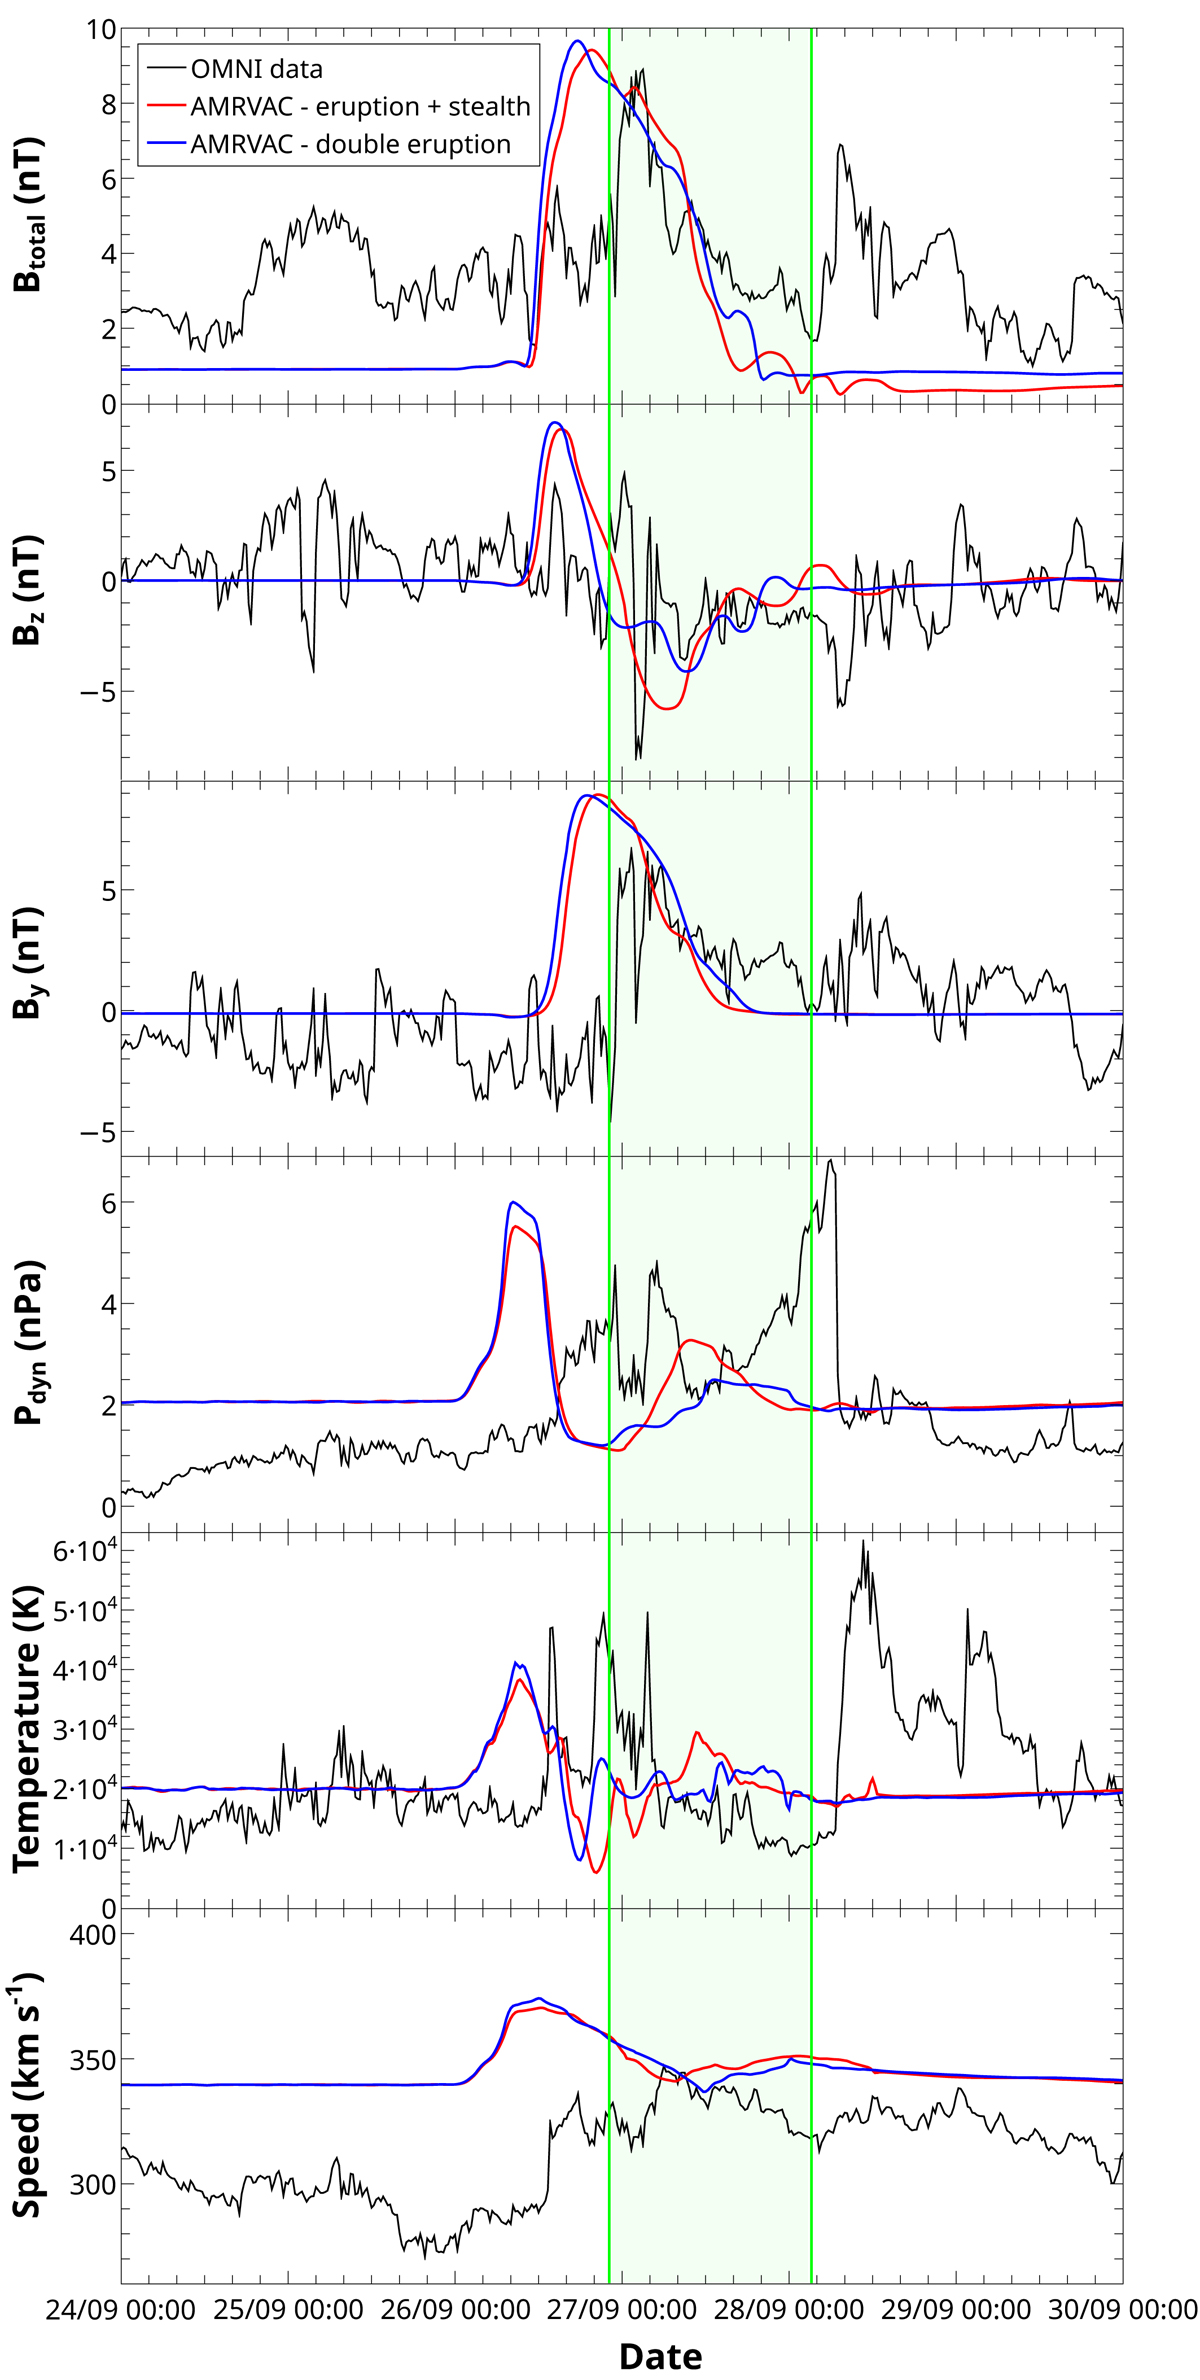
Fig. 8.
Download original image
In situ measured values of the magnetic field components, dynamic pressure, temperature, and speed of the solar wind (top to bottom) taken from the OMNI database (black line). Also plotted are simulation data in the eruption + stealth (red line) and double eruption (blue line) cases propagated in the slow wind and taken at 1 AU. The green highlighted area approximately delimits the ICME. The dates on the X axis are from the year 2009.
Current usage metrics show cumulative count of Article Views (full-text article views including HTML views, PDF and ePub downloads, according to the available data) and Abstracts Views on Vision4Press platform.
Data correspond to usage on the plateform after 2015. The current usage metrics is available 48-96 hours after online publication and is updated daily on week days.
Initial download of the metrics may take a while.