Fig. 7.
Download original image
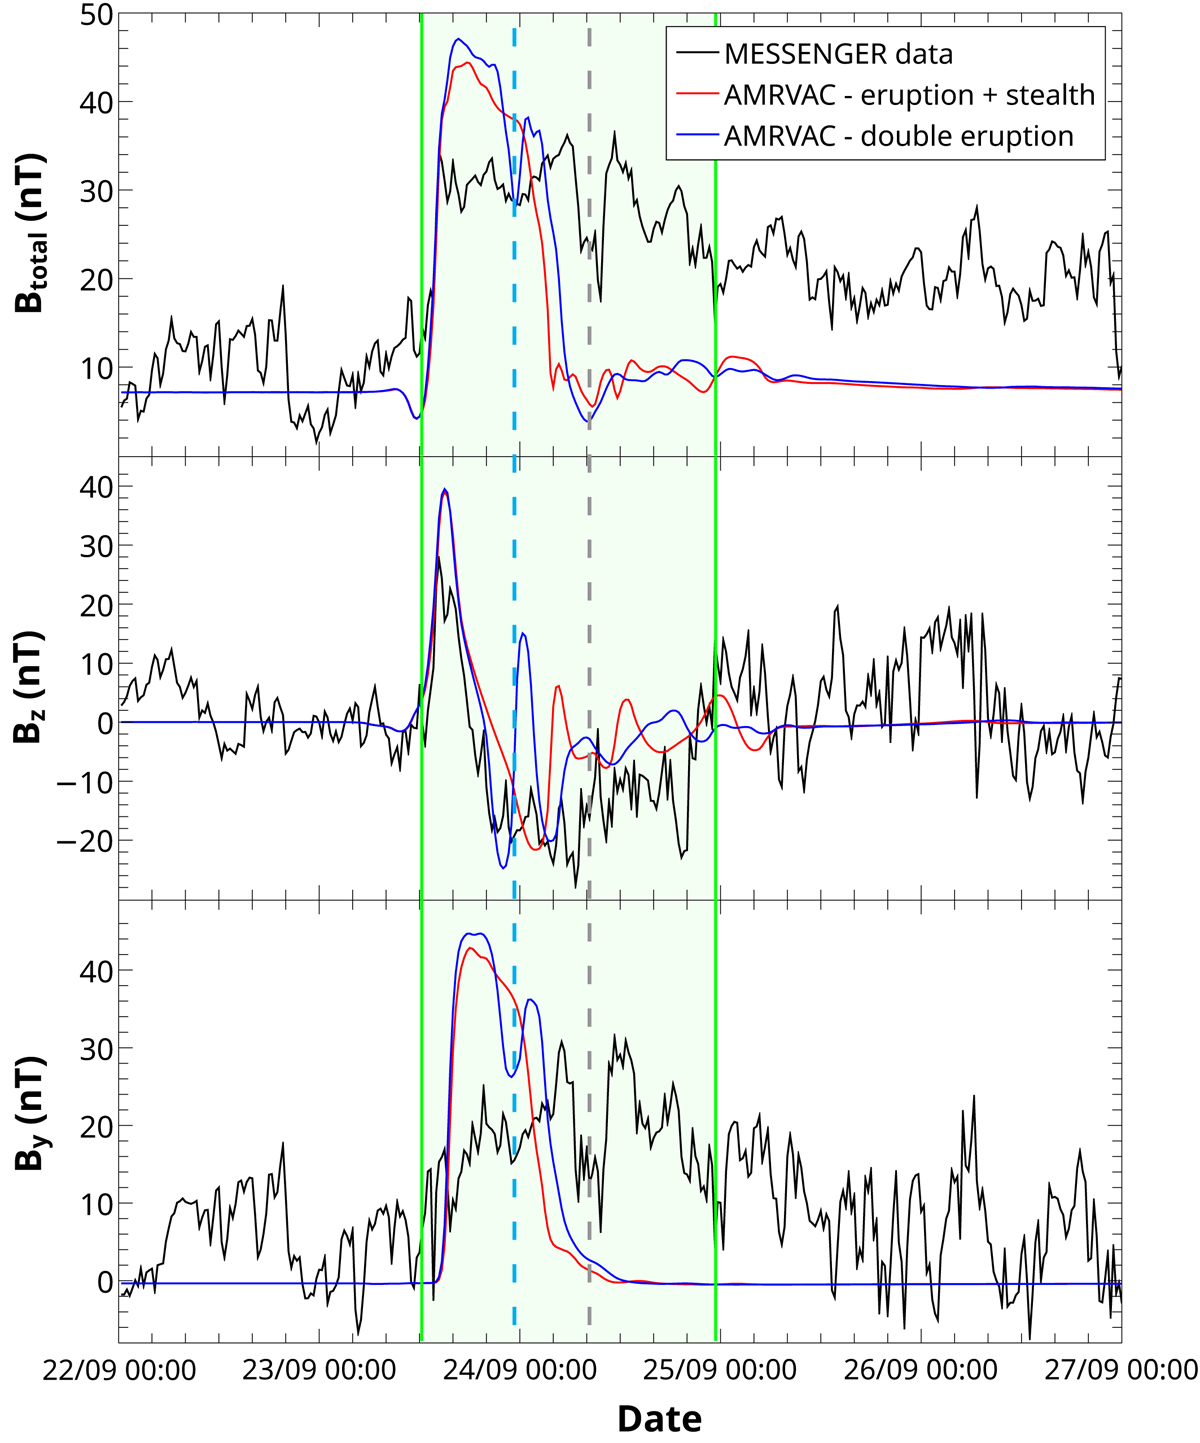
In situ measured components of the magnetic field taken by MESSENGER (black line), and simulation data in the eruption + stealth (red line) and double eruption (blue line) cases, propagated in the slow wind and taken at 75 R⊙. The green highlighted area approximately delimits the observed ICME. The cyan and grey dashed lines indicate the separation between the two flux ropes in the simulated double eruption case, and observed data, respectively. The dates on the X axis are from the year 2009.
Current usage metrics show cumulative count of Article Views (full-text article views including HTML views, PDF and ePub downloads, according to the available data) and Abstracts Views on Vision4Press platform.
Data correspond to usage on the plateform after 2015. The current usage metrics is available 48-96 hours after online publication and is updated daily on week days.
Initial download of the metrics may take a while.