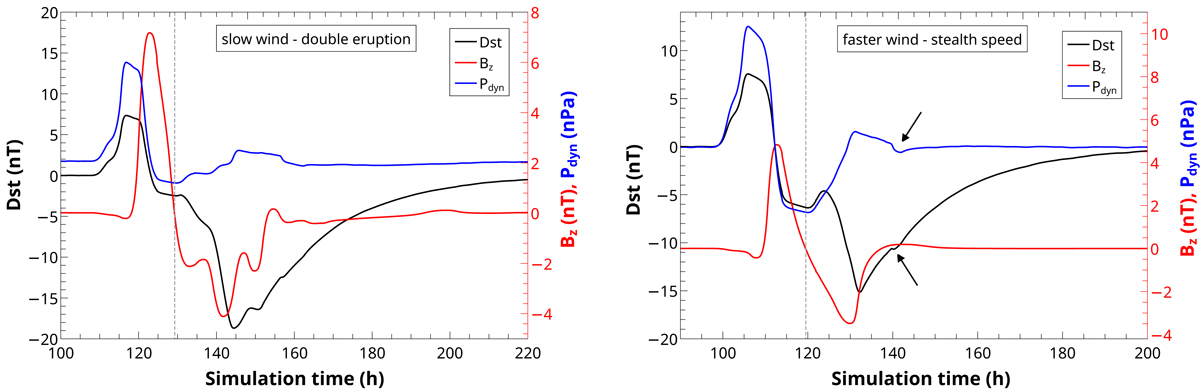
Fig. 12.
Download original image
Modelled Dst using simulation data (black line, left axis), the Bz component of the magnetic field (red line, right axis), and the dynamic pressure (blue line, right axis) in the case of the slow wind – double eruption (left side) and faster wind – stealth speed (right side). The curves have not been overlapped, and so they indicate the actual simulated arrival time. The grey dashed line shows the polarity reversal of Bz.
Current usage metrics show cumulative count of Article Views (full-text article views including HTML views, PDF and ePub downloads, according to the available data) and Abstracts Views on Vision4Press platform.
Data correspond to usage on the plateform after 2015. The current usage metrics is available 48-96 hours after online publication and is updated daily on week days.
Initial download of the metrics may take a while.