Free Access
Fig. 10.
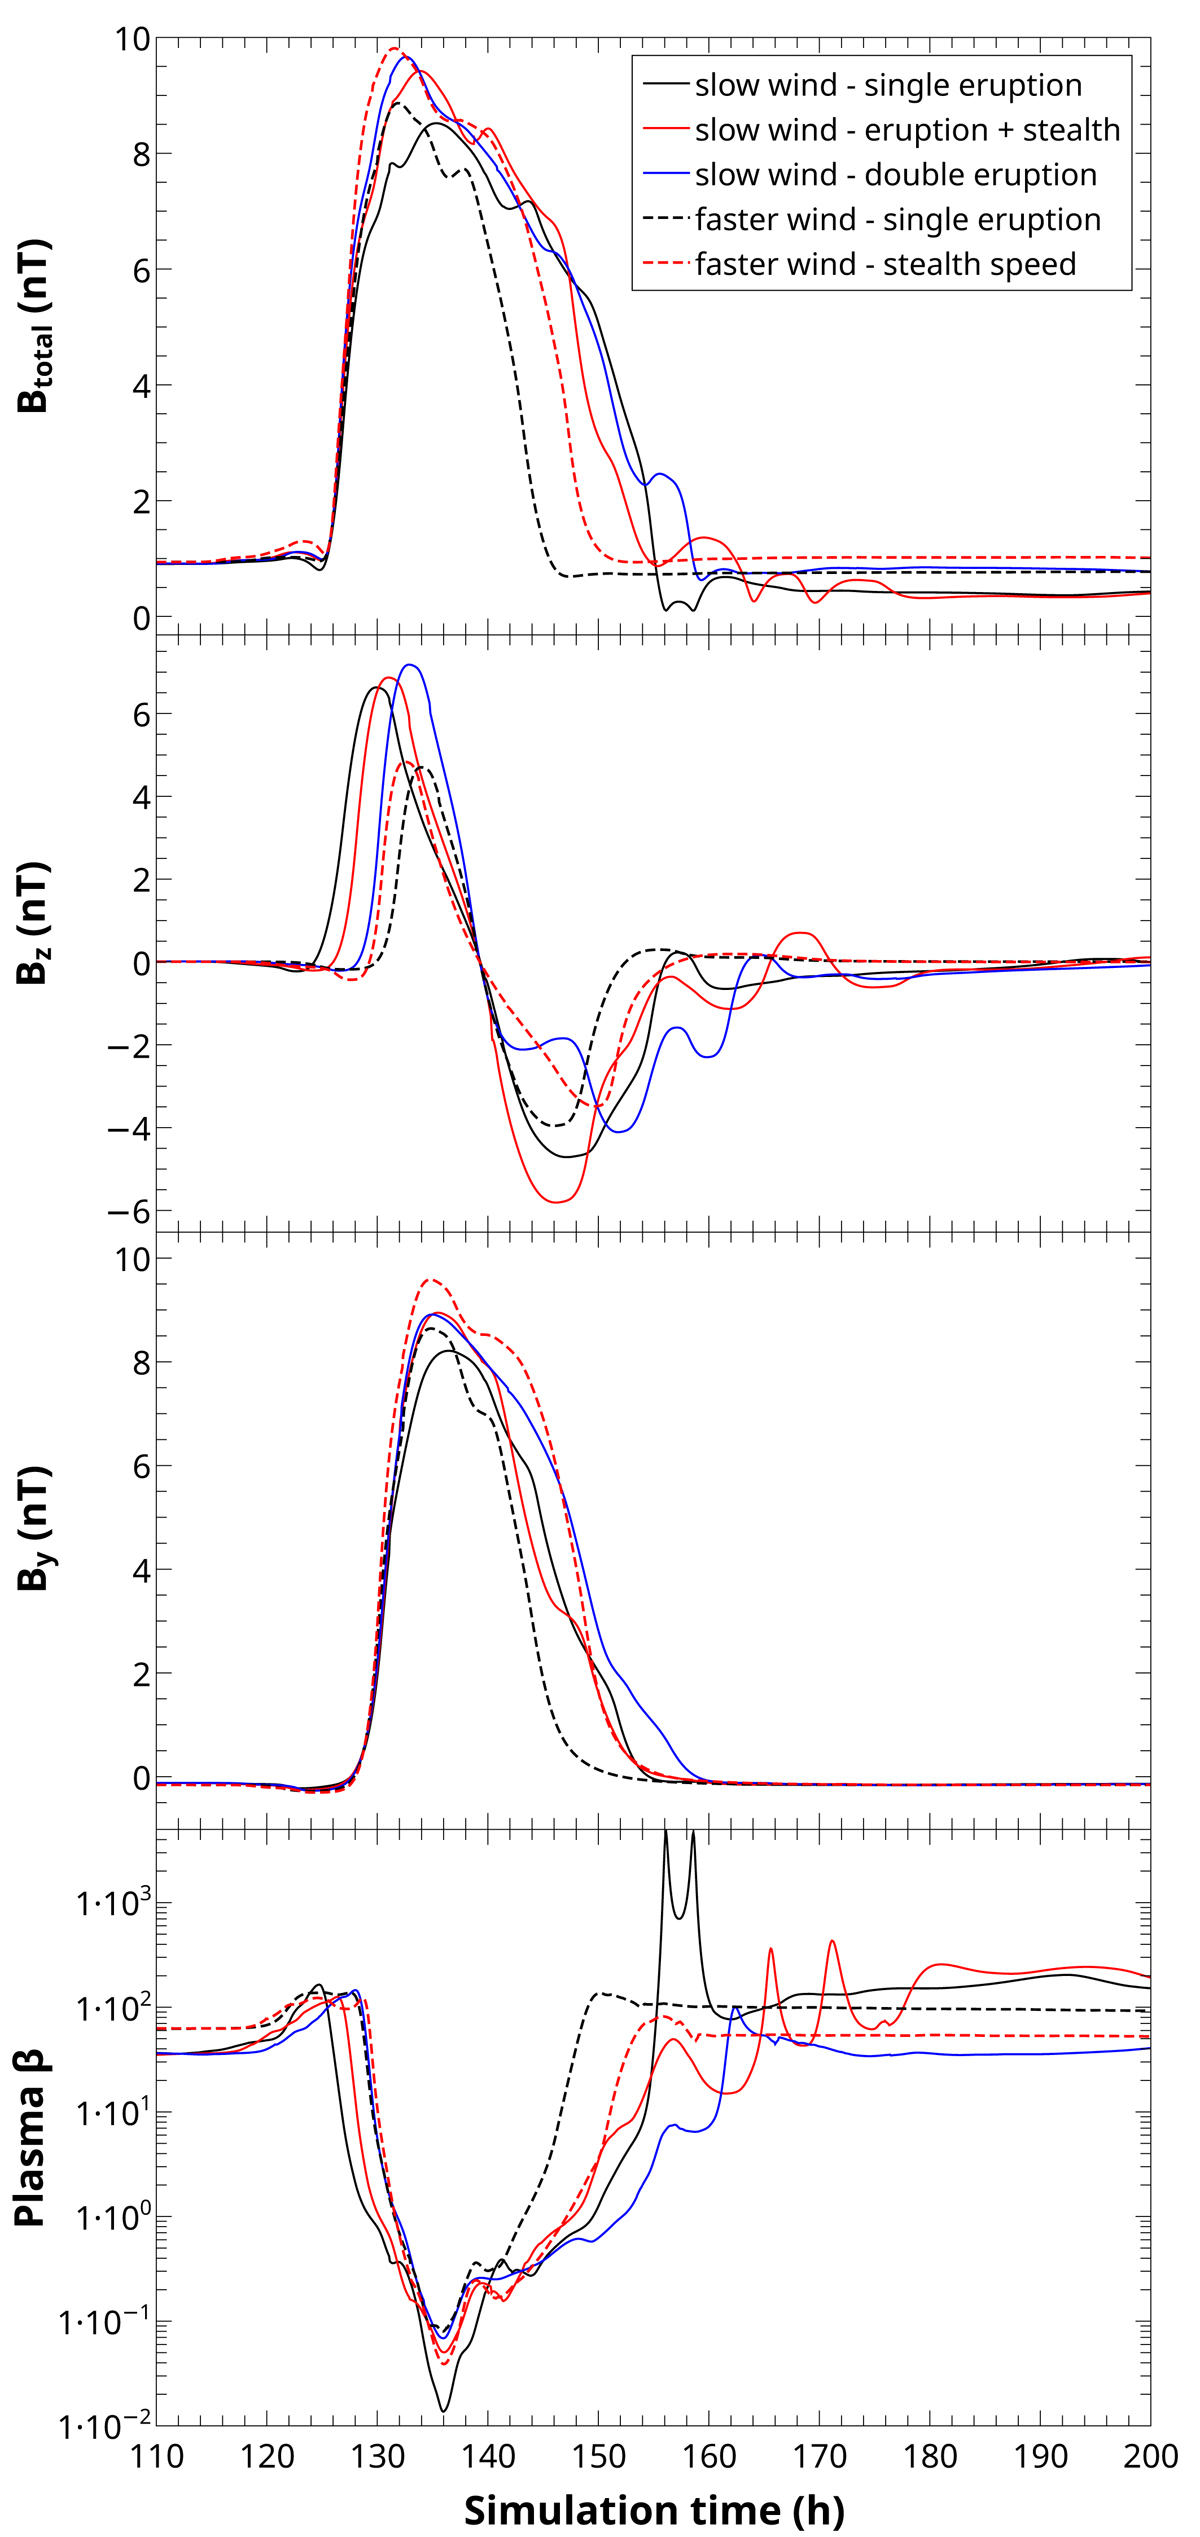
Download original image
Magnetic field components simulated in all five cases, taken on the equatorial plane at 1 AU. The magnetic field components are overlapped in the same way as in Fig. 9, and we overlapped the minima of the plasma beta curves with the curve of the slow wind, single eruption case.
Current usage metrics show cumulative count of Article Views (full-text article views including HTML views, PDF and ePub downloads, according to the available data) and Abstracts Views on Vision4Press platform.
Data correspond to usage on the plateform after 2015. The current usage metrics is available 48-96 hours after online publication and is updated daily on week days.
Initial download of the metrics may take a while.