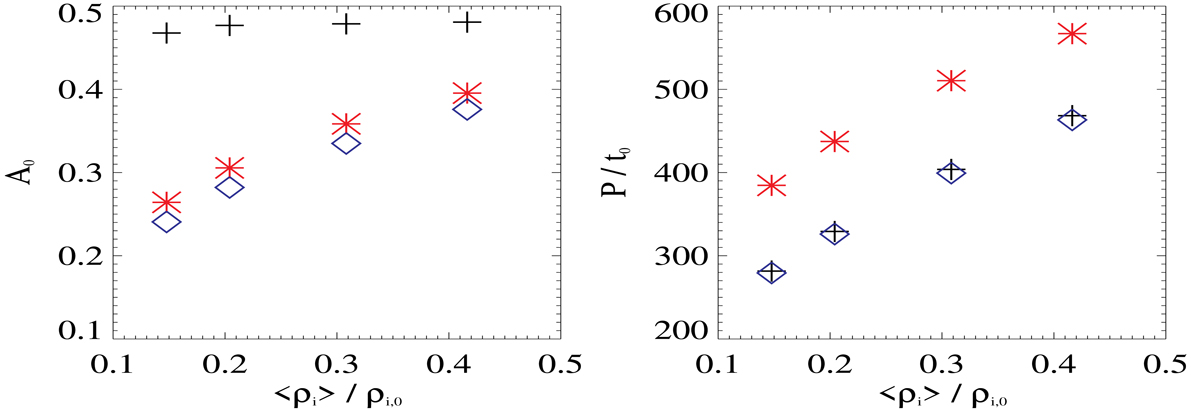
Fig. 9.
Download original image
Displacement (left) and oscillation period (right) as functions of average density. Black crosses correspond to simulations of tubes with uniform density and an amplitude of the initial perturbation given by V0 = 0.05cA. Red symbols represent the results with a Lorentzian profile and V0 = 0.05cA. Blue diamonds represent simulations of tubes with uniform density but an initial kinetic energy that is the same as the cases with the Lorentzian profile.
Current usage metrics show cumulative count of Article Views (full-text article views including HTML views, PDF and ePub downloads, according to the available data) and Abstracts Views on Vision4Press platform.
Data correspond to usage on the plateform after 2015. The current usage metrics is available 48-96 hours after online publication and is updated daily on week days.
Initial download of the metrics may take a while.