Fig. 8.
Download original image
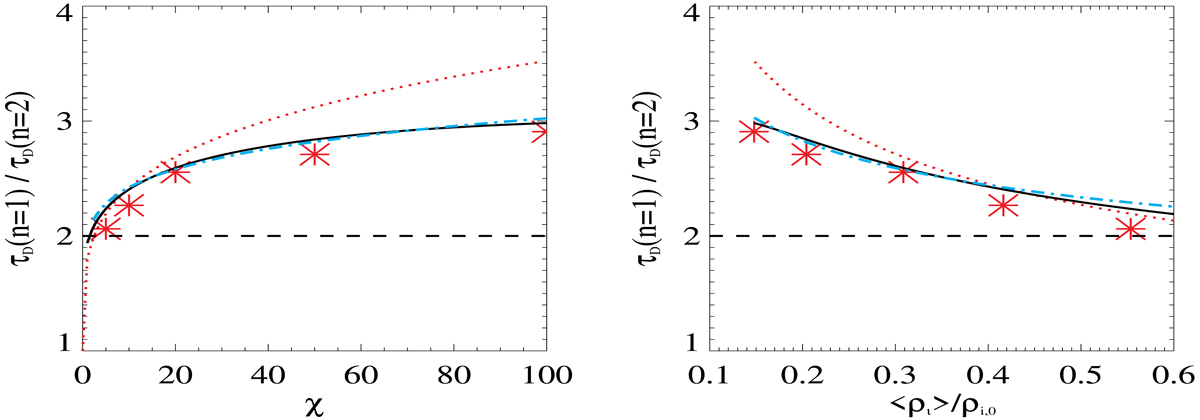
Damping time ratio as a function of density ratio (left) and as a function of the average density of the tube (right). Red asterisks represent the results from simulations. Solid black lines correspond to the results from the eigenvalue problem. Horizontal dashed lines represent the case of tubes with uniform density. The red dotted lines represent the approximations given by Eqs. (24) and (25). The blue dotted-dashed lines in the left and right panels represent the fits given by Eqs. (26) and (27), respectively.
Current usage metrics show cumulative count of Article Views (full-text article views including HTML views, PDF and ePub downloads, according to the available data) and Abstracts Views on Vision4Press platform.
Data correspond to usage on the plateform after 2015. The current usage metrics is available 48-96 hours after online publication and is updated daily on week days.
Initial download of the metrics may take a while.