Fig. 6.
Download original image
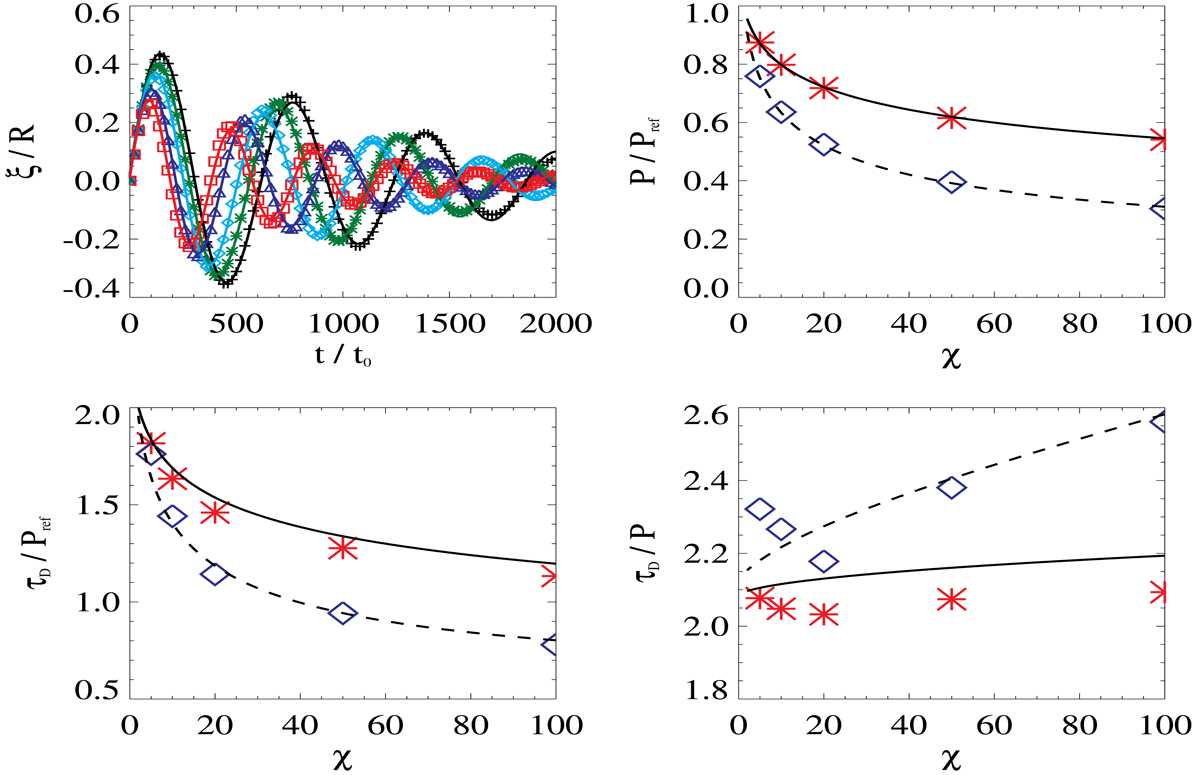
Results of the parametric study of transverse oscillations. Top left: displacement of centre of mass as a function of time from simulations with n = 1 and with χ = 5 (black crosses), χ = 10 (green asterisks), χ = 20 (light blue diamonds), χ = 50 (dark blue triangles), and χ = 100 (red squares). Top right: oscillation period as a function of the density contrast, χ. Bottom left: damping time as a function of χ. Bottom right: ratio of damping time to period as a function of χ. In the top left panel, solid lines represent fits of the numerical results. In the remaining panels, the black solid and dashed lines correspond to the results obtained by solving the 2D eigenvalue problem for n = 1 and n = 2, respectively. Symbols represent the results from the simulations. For n = 1, Pref = P0; for n = 2, Pref = P1.
Current usage metrics show cumulative count of Article Views (full-text article views including HTML views, PDF and ePub downloads, according to the available data) and Abstracts Views on Vision4Press platform.
Data correspond to usage on the plateform after 2015. The current usage metrics is available 48-96 hours after online publication and is updated daily on week days.
Initial download of the metrics may take a while.