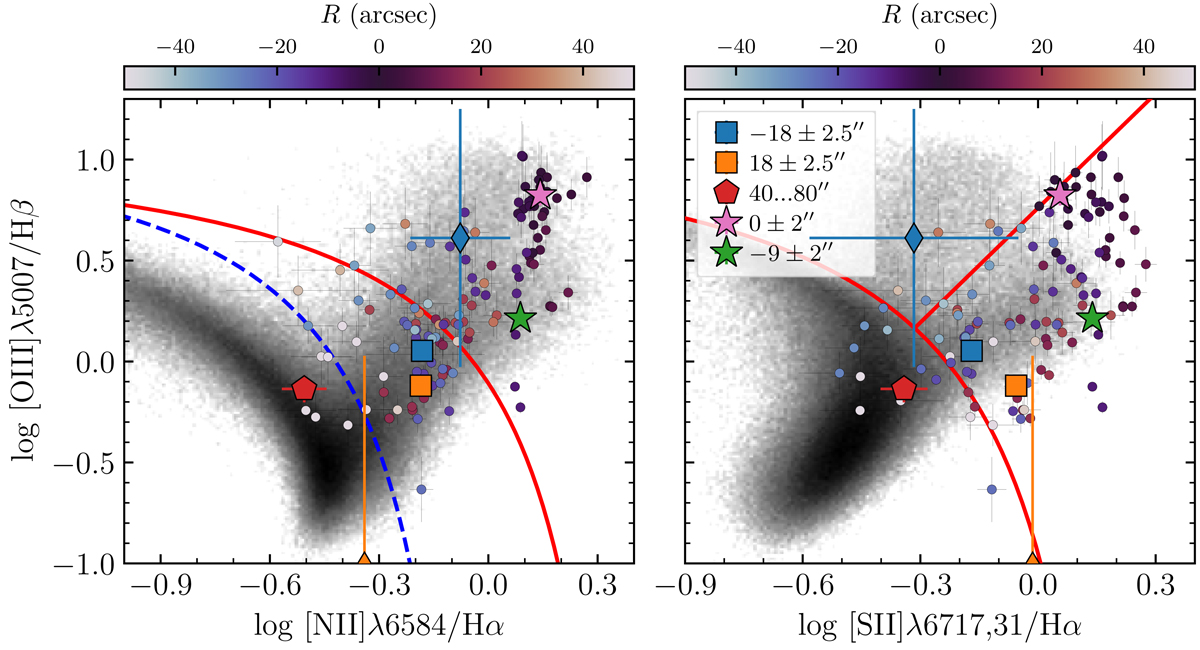
Fig. 9.
Download original image
Strong-line ratio diagnostic diagram. Black points with error bars represent our measurements in the individual spectra, while the colored squares refer to the average values for the inner and outer emission-line rings. The nucleus is shown by a large purple star. The averaged values marked by color symbols correspond to the stripes of the same color in Figs. 7 and 8. The red lines show theoretical demarcation lines by Kewley et al. (2001) separating the parameter space according to different excitation mechanisms. The blue dashed line is an empirical separating line from Kauffmann et al. (2003). The distribution of emission-line measurements taken from the Reference Catalog of Galaxy SEDs (RCSED, http://rcsed.sai.msu.ru, Chilingarian et al. 2017) is shown in gray.
Current usage metrics show cumulative count of Article Views (full-text article views including HTML views, PDF and ePub downloads, according to the available data) and Abstracts Views on Vision4Press platform.
Data correspond to usage on the plateform after 2015. The current usage metrics is available 48-96 hours after online publication and is updated daily on week days.
Initial download of the metrics may take a while.