Fig. 6.
Download original image
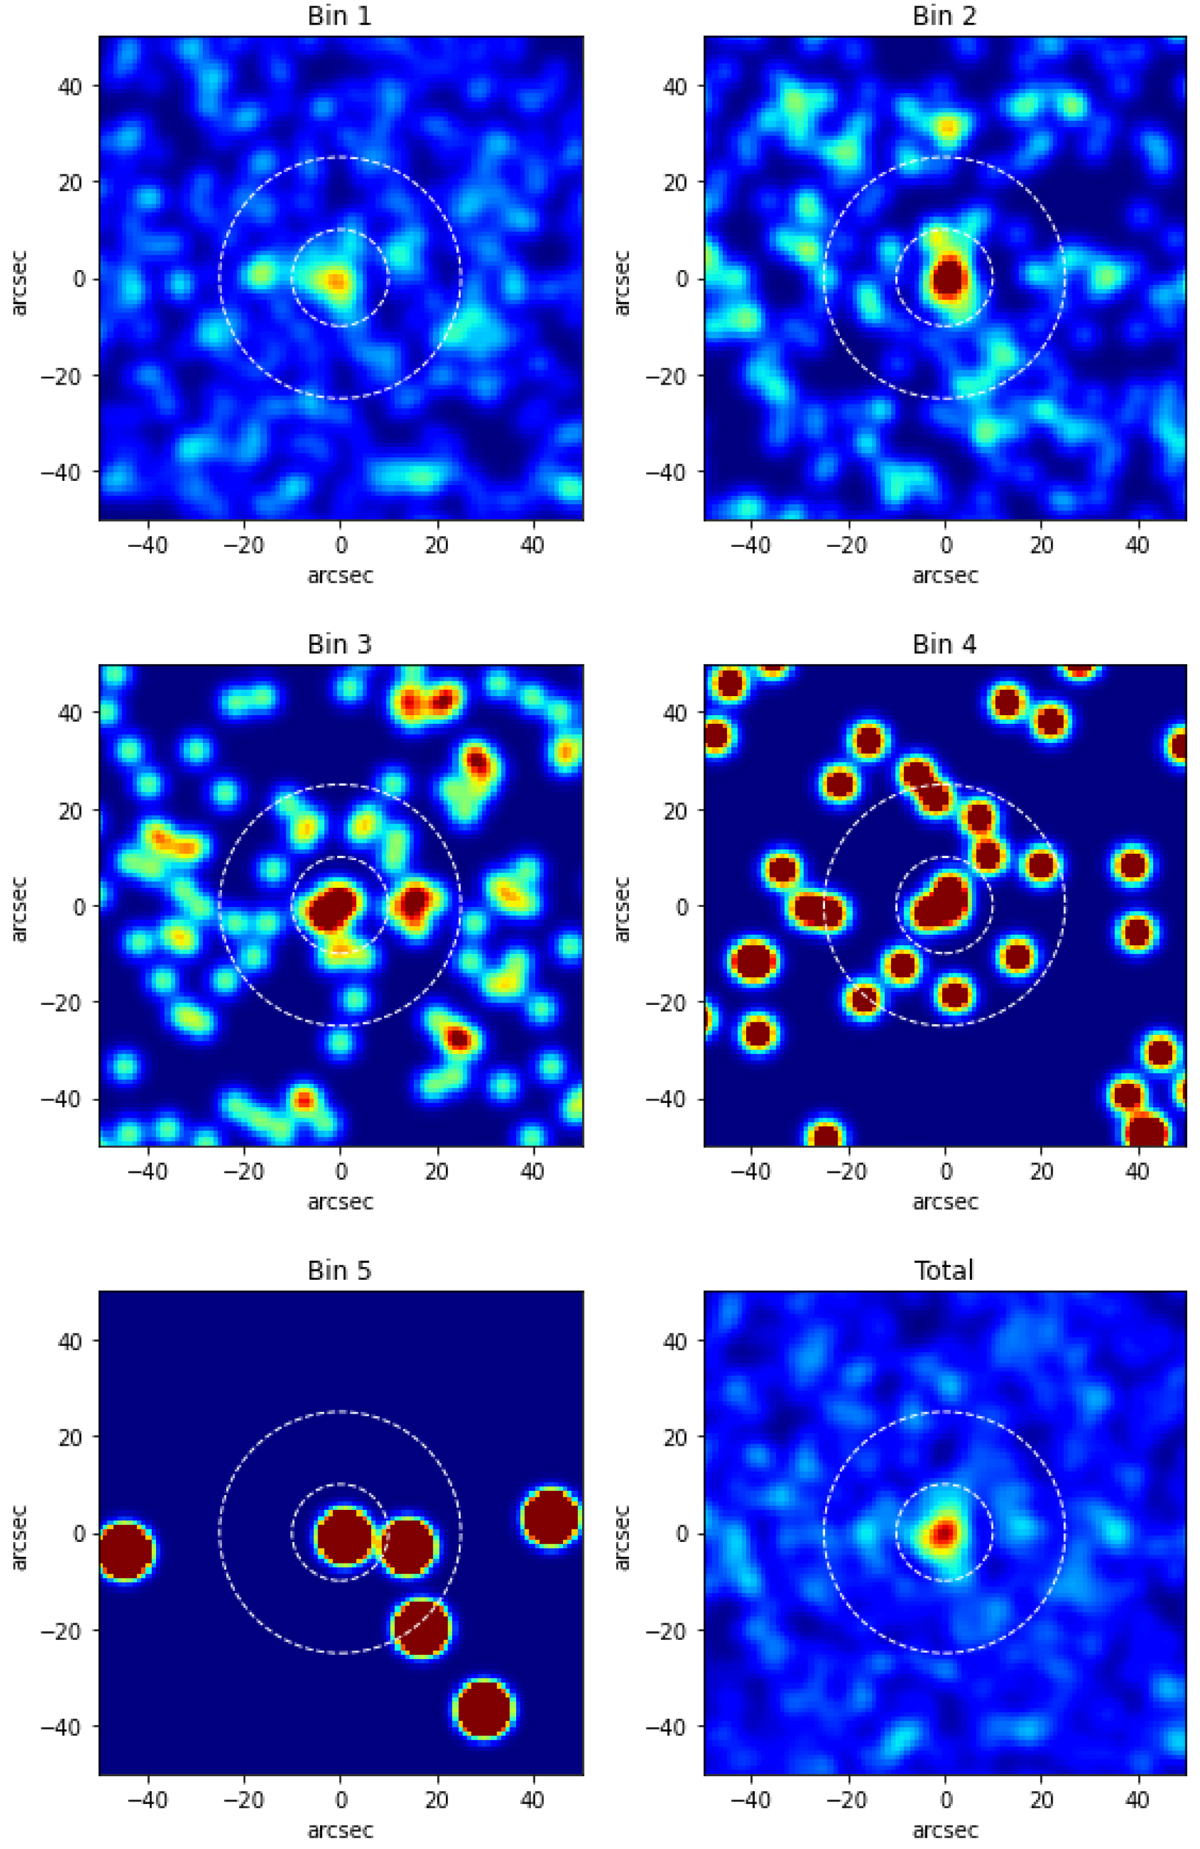
Highlight of the stacked maps of CG pairs for each richness bin at angular scales of lower that 50 arcsec. The maps are for bins 1 to 5 in the panels from left to right, and top to bottom. Bottom-right panel: highlight for the total case. The colour scale was chosen to improve visibility of the individual CG pairs and is the same for all panels. The two concentric circles (white dashed lines) indicate the radii of ∼10 and ∼25 arcsec.
Current usage metrics show cumulative count of Article Views (full-text article views including HTML views, PDF and ePub downloads, according to the available data) and Abstracts Views on Vision4Press platform.
Data correspond to usage on the plateform after 2015. The current usage metrics is available 48-96 hours after online publication and is updated daily on week days.
Initial download of the metrics may take a while.