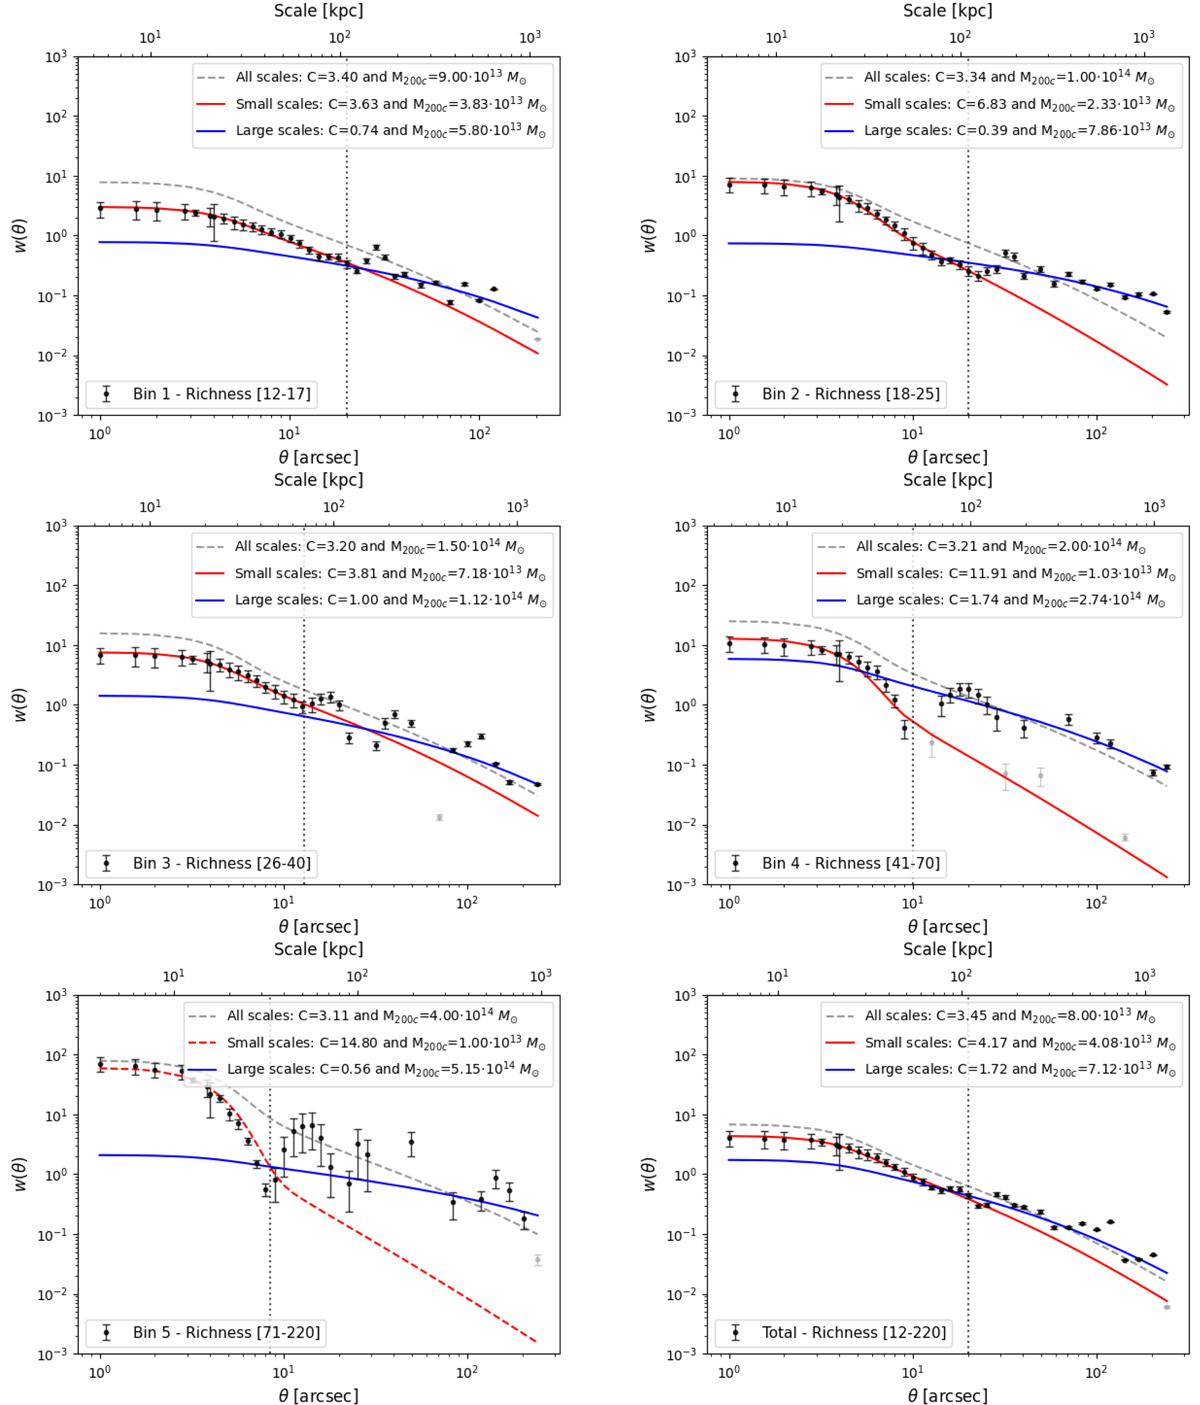
Fig. 5.
Download original image
NFW fits to the cross-correlation data for bins 1 to 5 (from left to right, top to bottom) and the general case (bottom right). The red line corresponds to the fit to the points at the small scales only and the blue one is for large scales. The grey dashed lines show the NFW profile using the mass–concentration relationship by Mandelbaum et al. (2008) and, as explained in the text, it is not a best fit to the data; neither is the red dashed line for bin 5 (the parameter values are chosen by hand in order to produce a reasonable fit). The vertical dotted lines separate the two regimes that have been studied for each case. Grey points are considered outliers and are not taken into account for the analysis.
Current usage metrics show cumulative count of Article Views (full-text article views including HTML views, PDF and ePub downloads, according to the available data) and Abstracts Views on Vision4Press platform.
Data correspond to usage on the plateform after 2015. The current usage metrics is available 48-96 hours after online publication and is updated daily on week days.
Initial download of the metrics may take a while.