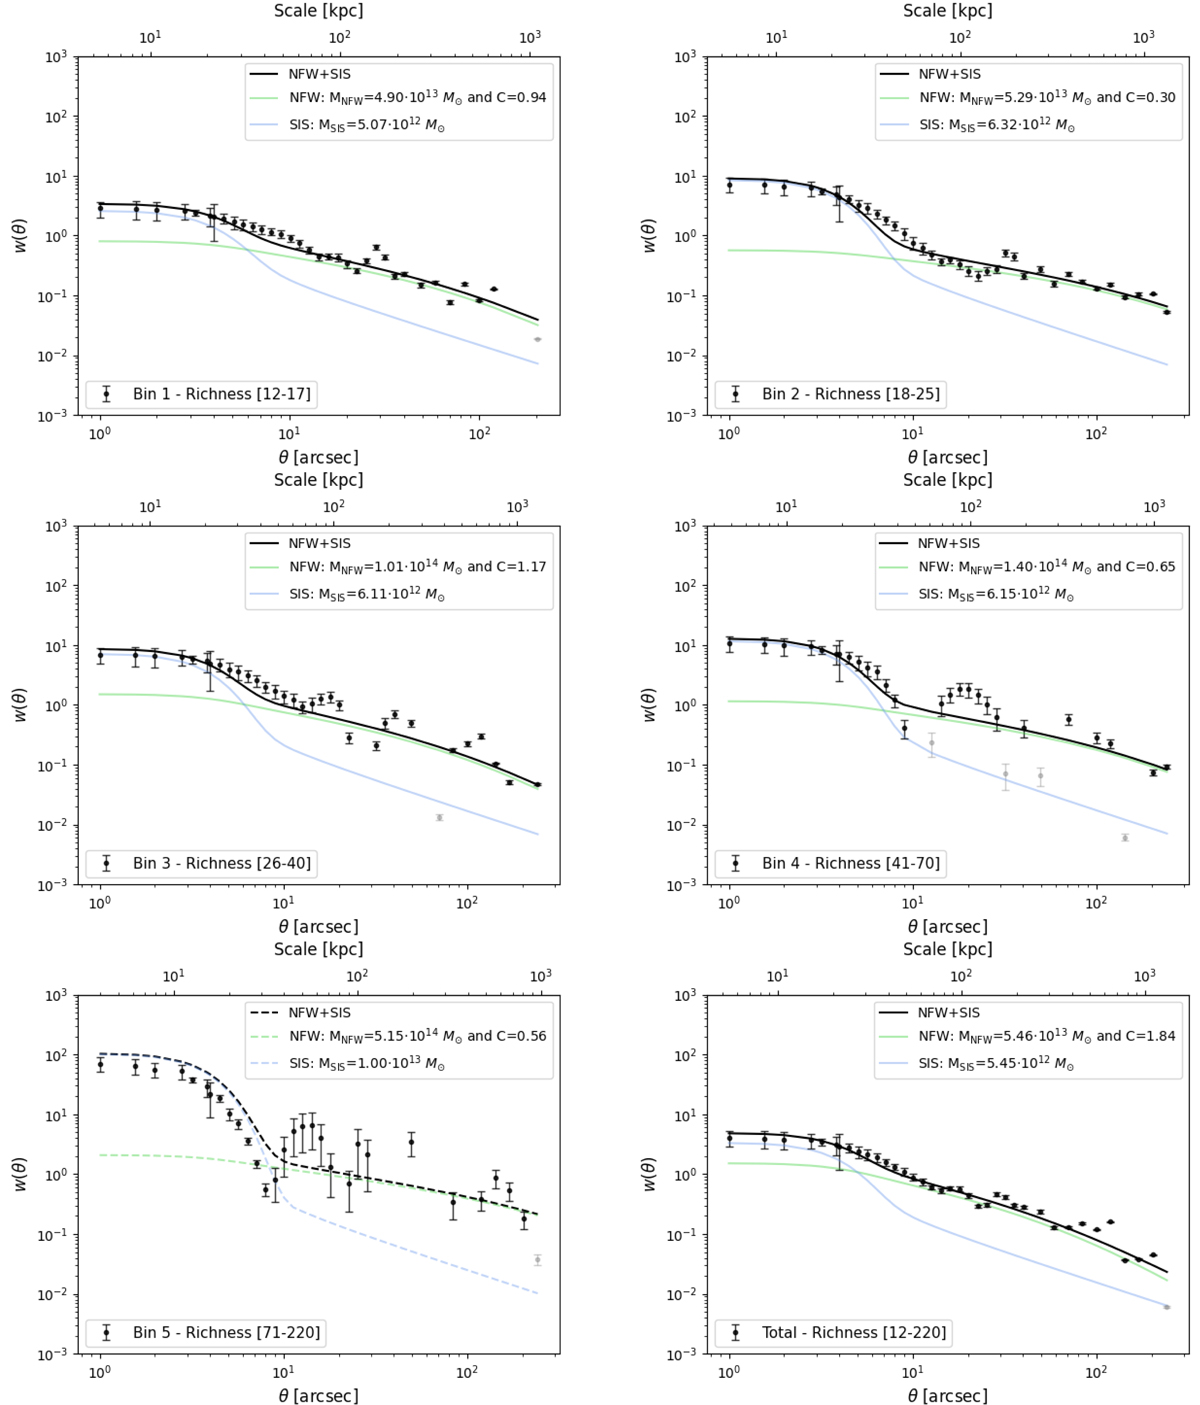
Fig. 4.
Download original image
NFW+SIS fits (black line) to the cross-correlation data (black points) for bins 1 to 5 (from left to right, top to bottom) and the general case (bottom right). The corresponding SIS (blue lines) and NFW (green lines) fits are also separately shown. As discussed in more detail in Sects. 5.1.1 and 5.3, the best fits are always below the data for angular separations of between 5 and 10 arcsec and there is a potential lack of power at ∼10 and ∼25 arcsec. Grey points are considered outliers and are not taken into account for the analysis. The dashed lines for bin 5 indicates that the values were chosen by hand in order to produce a reasonable fit because the fitting algorithm does not converge (see text for more details).
Current usage metrics show cumulative count of Article Views (full-text article views including HTML views, PDF and ePub downloads, according to the available data) and Abstracts Views on Vision4Press platform.
Data correspond to usage on the plateform after 2015. The current usage metrics is available 48-96 hours after online publication and is updated daily on week days.
Initial download of the metrics may take a while.