Free Access
Fig. 1.
Download original image
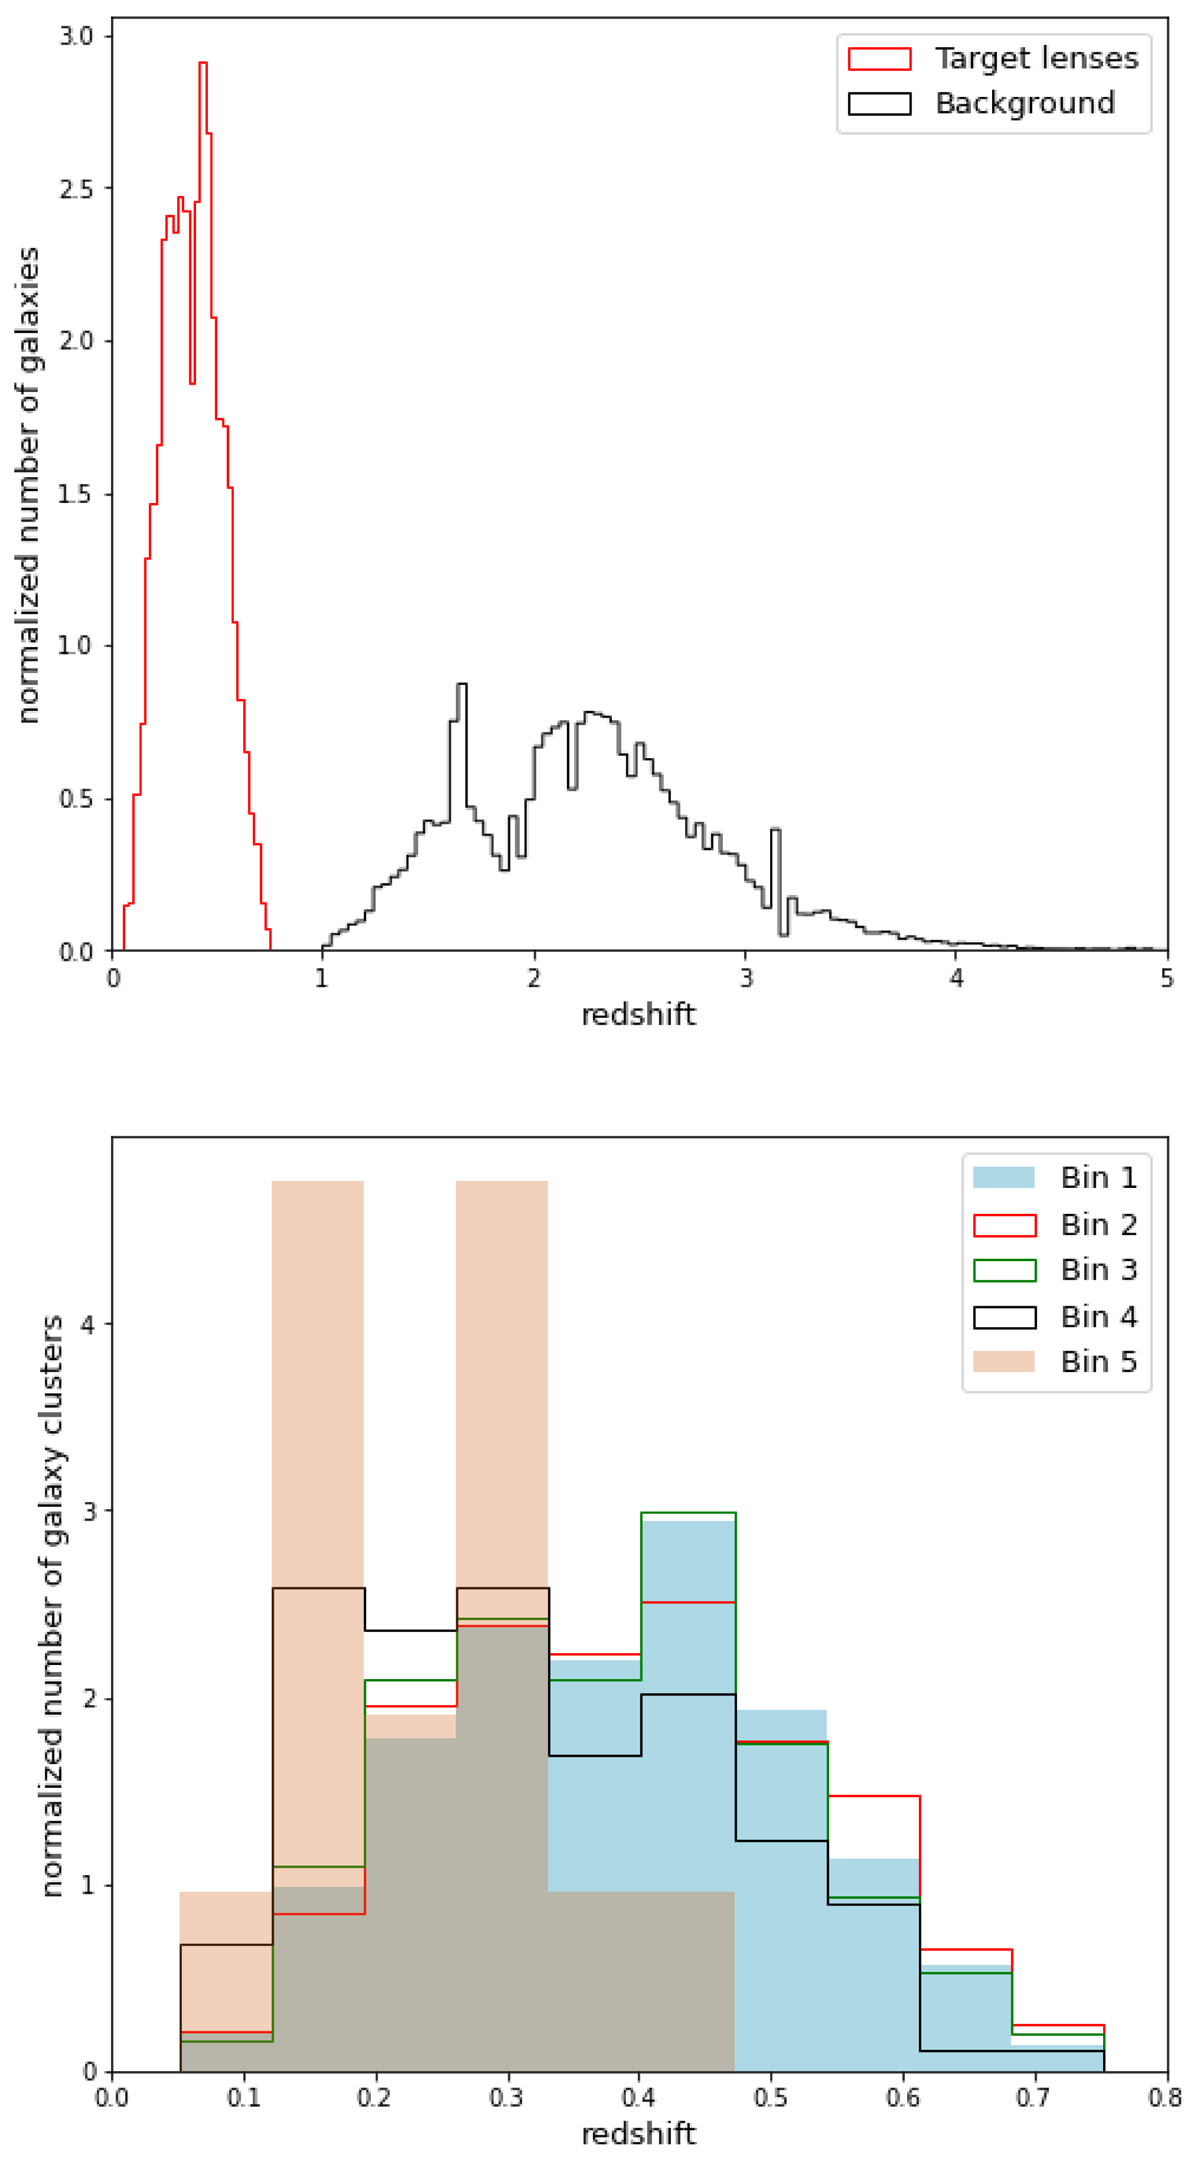
Top: redshift distribution of the target lenses from the Wen et al. (2012) catalogue (in red) and the background sources from the H-ATLAS sample (in black). Bottom: redshift distribution of the galaxy clusters for each of the five richness bins.
Current usage metrics show cumulative count of Article Views (full-text article views including HTML views, PDF and ePub downloads, according to the available data) and Abstracts Views on Vision4Press platform.
Data correspond to usage on the plateform after 2015. The current usage metrics is available 48-96 hours after online publication and is updated daily on week days.
Initial download of the metrics may take a while.