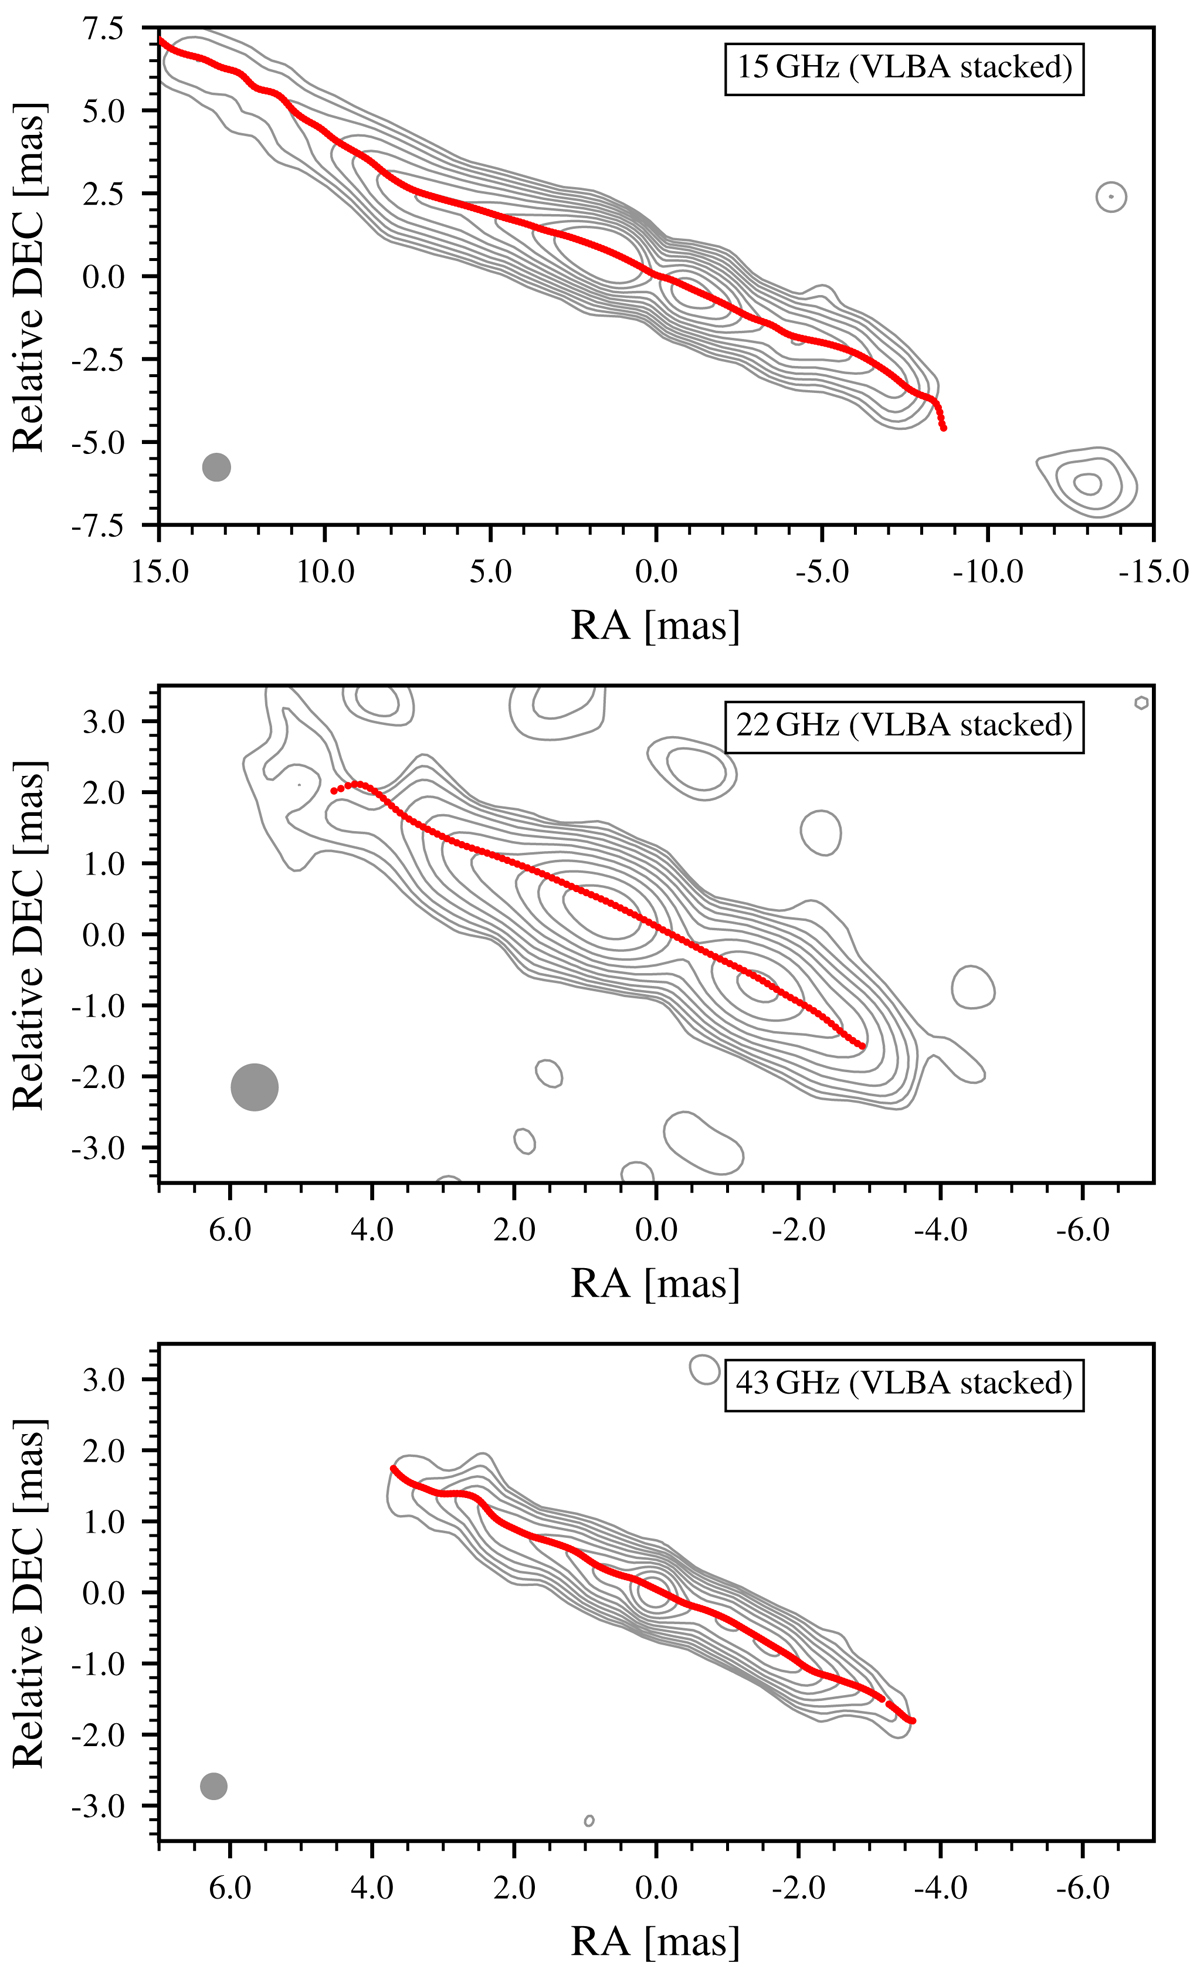
Fig. 4.
Download original image
Stacked images based on four years of VLBA observations at 15 GHz, 22 GHz, and 43 GHz (Baczko et al. 2019; Lister et al. 2019) restored with a circular beam. The ridge lines are plotted on top (red dots). The contours start at 0.5 times the noise level for 15 GHz, 22 GHz, and 43 GHz, which is derived as the mean rms from the individual images and increases logarithmically by a factor of two (compare Cols. 2 and 5 of Table 2).
Current usage metrics show cumulative count of Article Views (full-text article views including HTML views, PDF and ePub downloads, according to the available data) and Abstracts Views on Vision4Press platform.
Data correspond to usage on the plateform after 2015. The current usage metrics is available 48-96 hours after online publication and is updated daily on week days.
Initial download of the metrics may take a while.