Free Access
Fig. 3.
Download original image
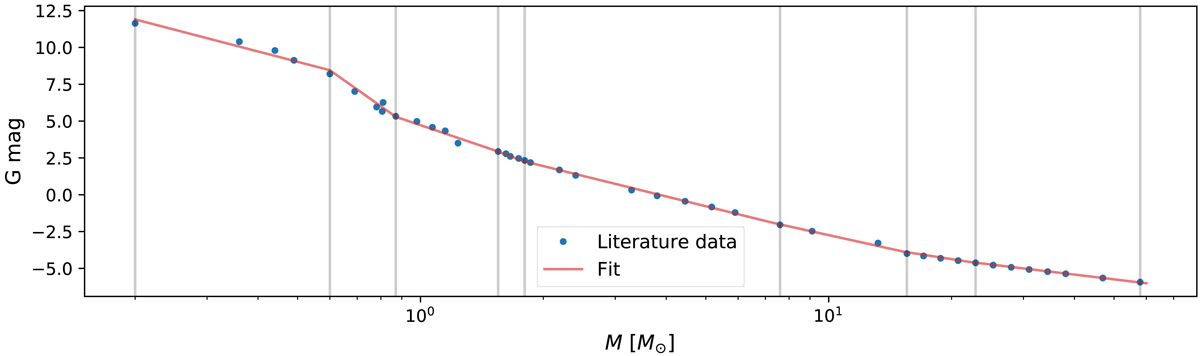
G-band magnitudes for dwarfs in the mass range 0.2–55.67 M⊙ obtained from the literature (see Table D.1). The masses are shown on a logarithmic scale. The fit is shown with a solid red line. Grey vertical lines indicate the fitted regions.
Current usage metrics show cumulative count of Article Views (full-text article views including HTML views, PDF and ePub downloads, according to the available data) and Abstracts Views on Vision4Press platform.
Data correspond to usage on the plateform after 2015. The current usage metrics is available 48-96 hours after online publication and is updated daily on week days.
Initial download of the metrics may take a while.