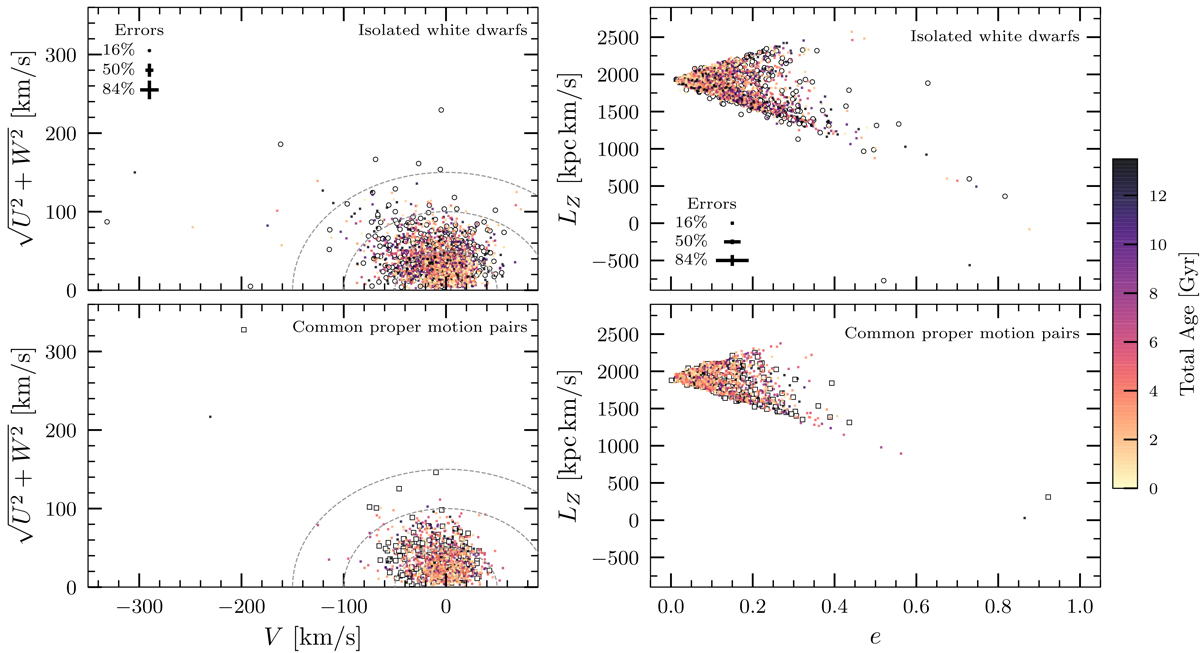
Fig. 7.
Download original image
Toomre diagram (left panels) and azimuthal action vs. eccentricity (right panels) of single white dwarfs (top panels) and common proper motion pairs (bottom panels). The velocity components are in the rotating rest frame. Colors and symbols are the same as in Fig. 6. The quantiles of the error bar distributions are also plotted for the isolated white dwarfs. The dashed curves in the Toomre diagrams (left panels) are circles with diameters of 100, 200, and 300 km s−1.
Current usage metrics show cumulative count of Article Views (full-text article views including HTML views, PDF and ePub downloads, according to the available data) and Abstracts Views on Vision4Press platform.
Data correspond to usage on the plateform after 2015. The current usage metrics is available 48-96 hours after online publication and is updated daily on week days.
Initial download of the metrics may take a while.