Fig. 7.
Download original image
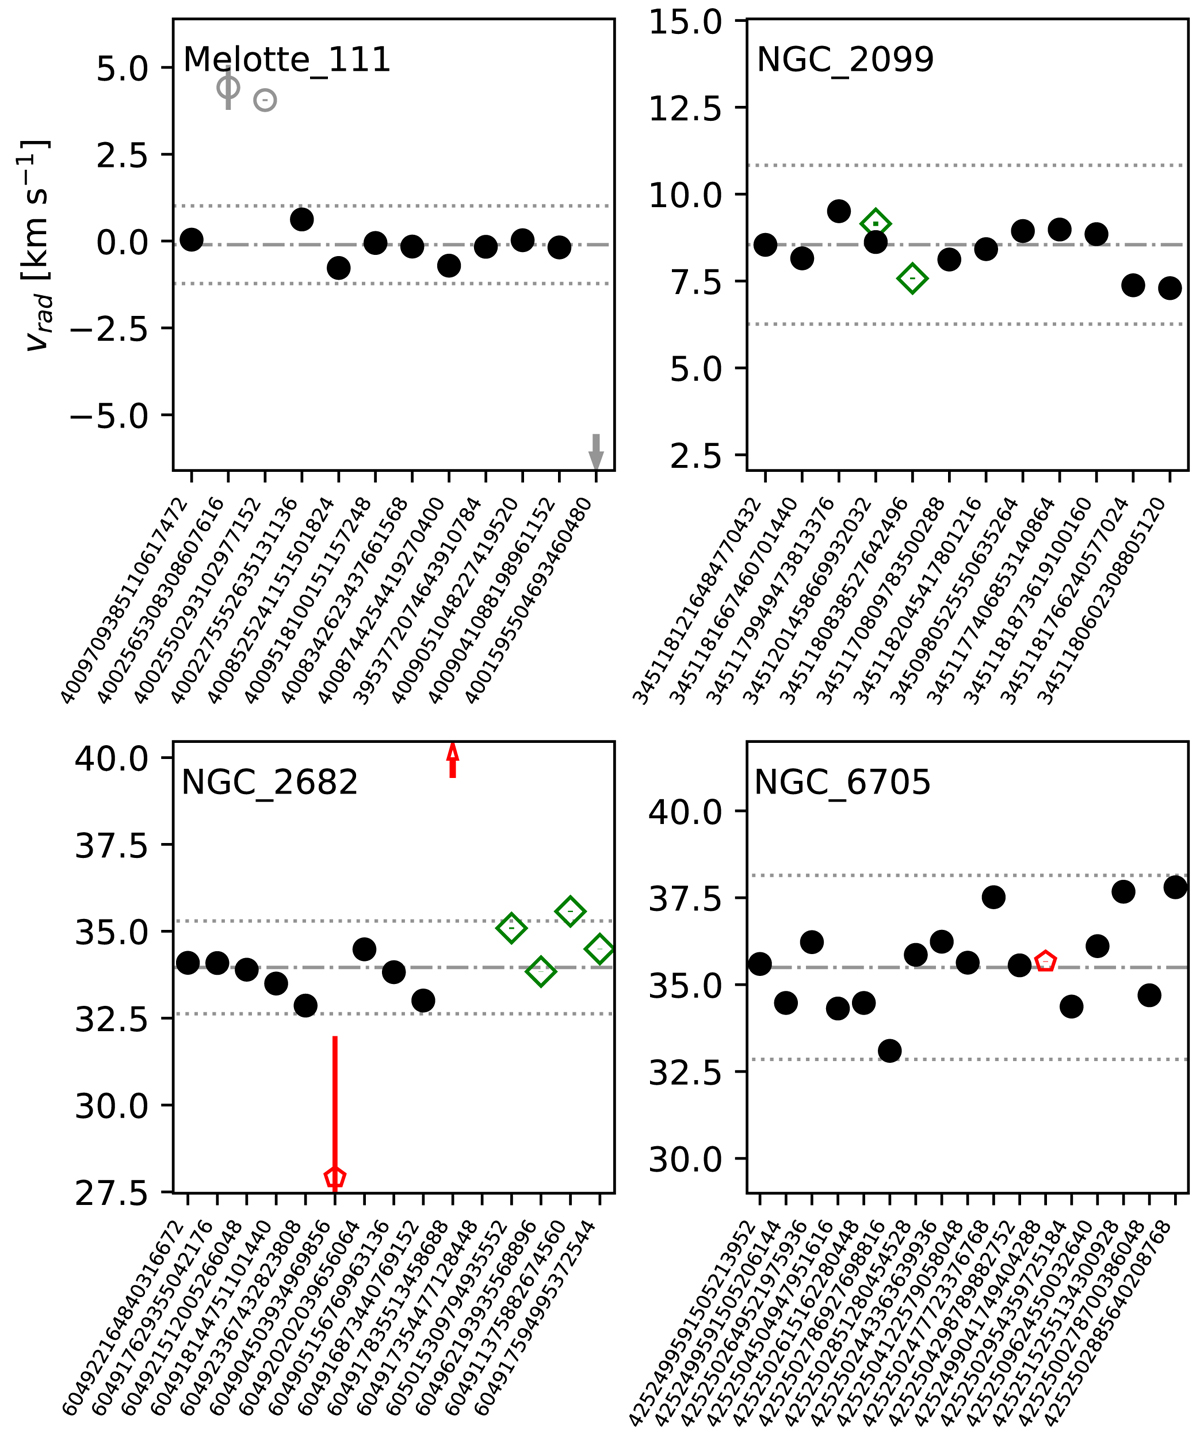
Determination of average radial velocity for each cluster. Filled symbols mark those stars used to determine the average value, while open symbols are the excluded objects. Black circles represent those stars observed with MERC, NOT1, and NOT2, while green diamonds are the stars observed with CAH2. Red pentagons are the known spectroscopic binaries. Arrows denote objects outside the panels. Dot-dashed lines correspond to the average radial velocity for each cluster. Dotted lines show the 3 × σvrad level. We note that in most of the cases, error bars are smaller than the symbol size. All source identifications are from Gaia EDR3.
Current usage metrics show cumulative count of Article Views (full-text article views including HTML views, PDF and ePub downloads, according to the available data) and Abstracts Views on Vision4Press platform.
Data correspond to usage on the plateform after 2015. The current usage metrics is available 48-96 hours after online publication and is updated daily on week days.
Initial download of the metrics may take a while.