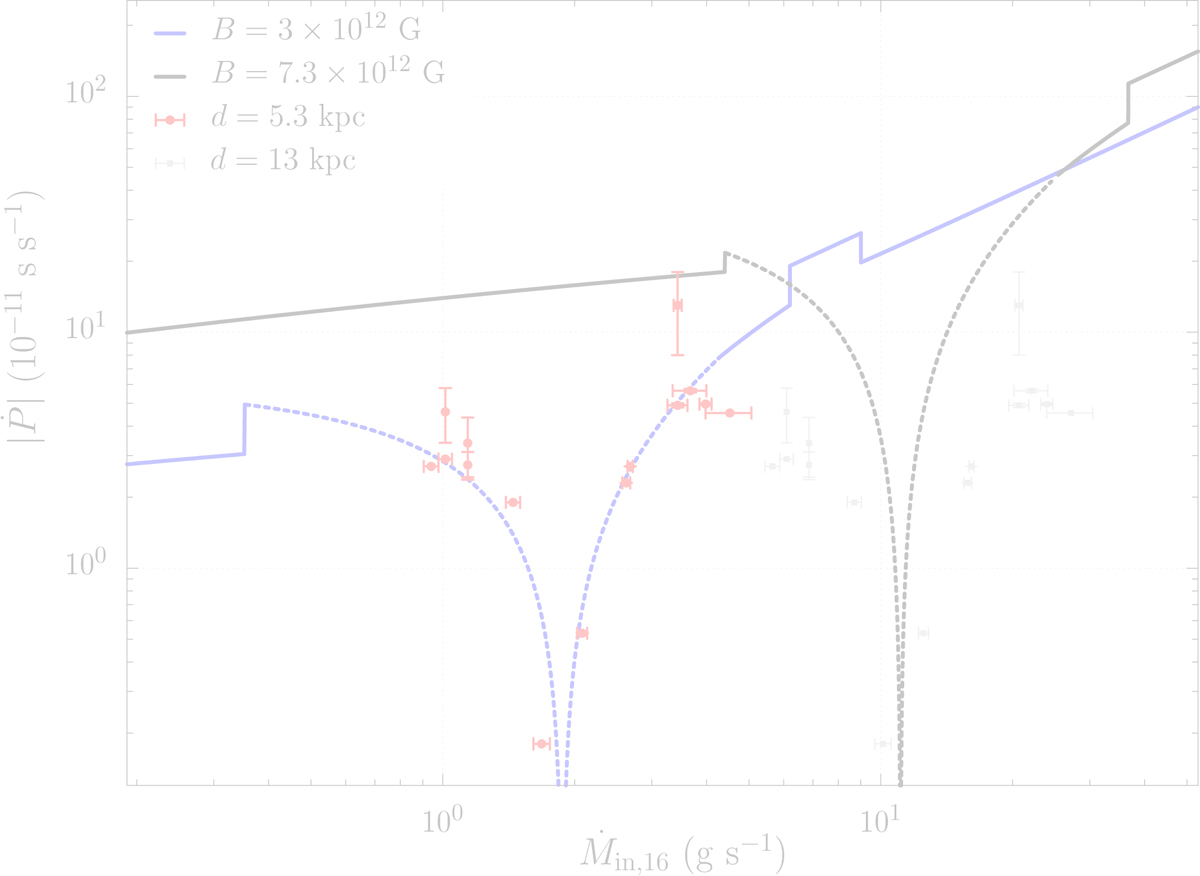
Fig. 2.
Download original image
Illustrative model curves with torque-reversals corresponding to Ṁin values. The blue model curve is the same as given in Fig. 1b (Δr/rin = 0.2, η = 1 and ξ = 0.8). The black curve is also obtained with the same disk parameters, but for a larger distance that requires a stronger B and a higher Ṁin during the torque reversal. The magnetic field B and distance d values used in the models are given in the figure. It is clearly seen that the model with the larger d cannot reproduce the data (grey data points).
Current usage metrics show cumulative count of Article Views (full-text article views including HTML views, PDF and ePub downloads, according to the available data) and Abstracts Views on Vision4Press platform.
Data correspond to usage on the plateform after 2015. The current usage metrics is available 48-96 hours after online publication and is updated daily on week days.
Initial download of the metrics may take a while.