Fig. 3.
Download original image
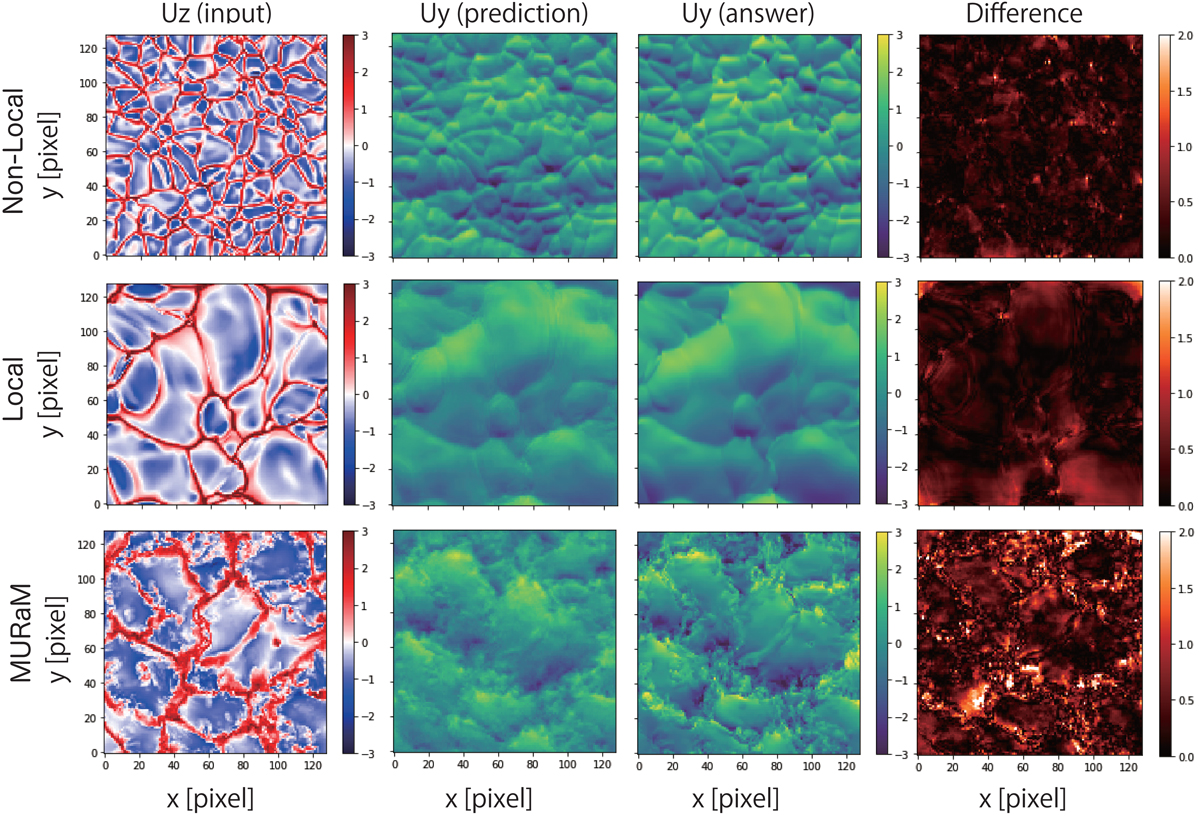
Spatial distributions of the vertical velocity, Y component of the horizontal velocities during the prediction and simulation, and the difference between them in the non-local model (top), the local model (middle), and the MURaM model (bottom). The vertical velocity and horizontal velocity in the simulation are normalized as zero mean with unit dispersion. The vertical velocity and temperature are used as inputs even though only the vertical velocity is shown in this figure.
Current usage metrics show cumulative count of Article Views (full-text article views including HTML views, PDF and ePub downloads, according to the available data) and Abstracts Views on Vision4Press platform.
Data correspond to usage on the plateform after 2015. The current usage metrics is available 48-96 hours after online publication and is updated daily on week days.
Initial download of the metrics may take a while.