Fig. 2.
Download original image
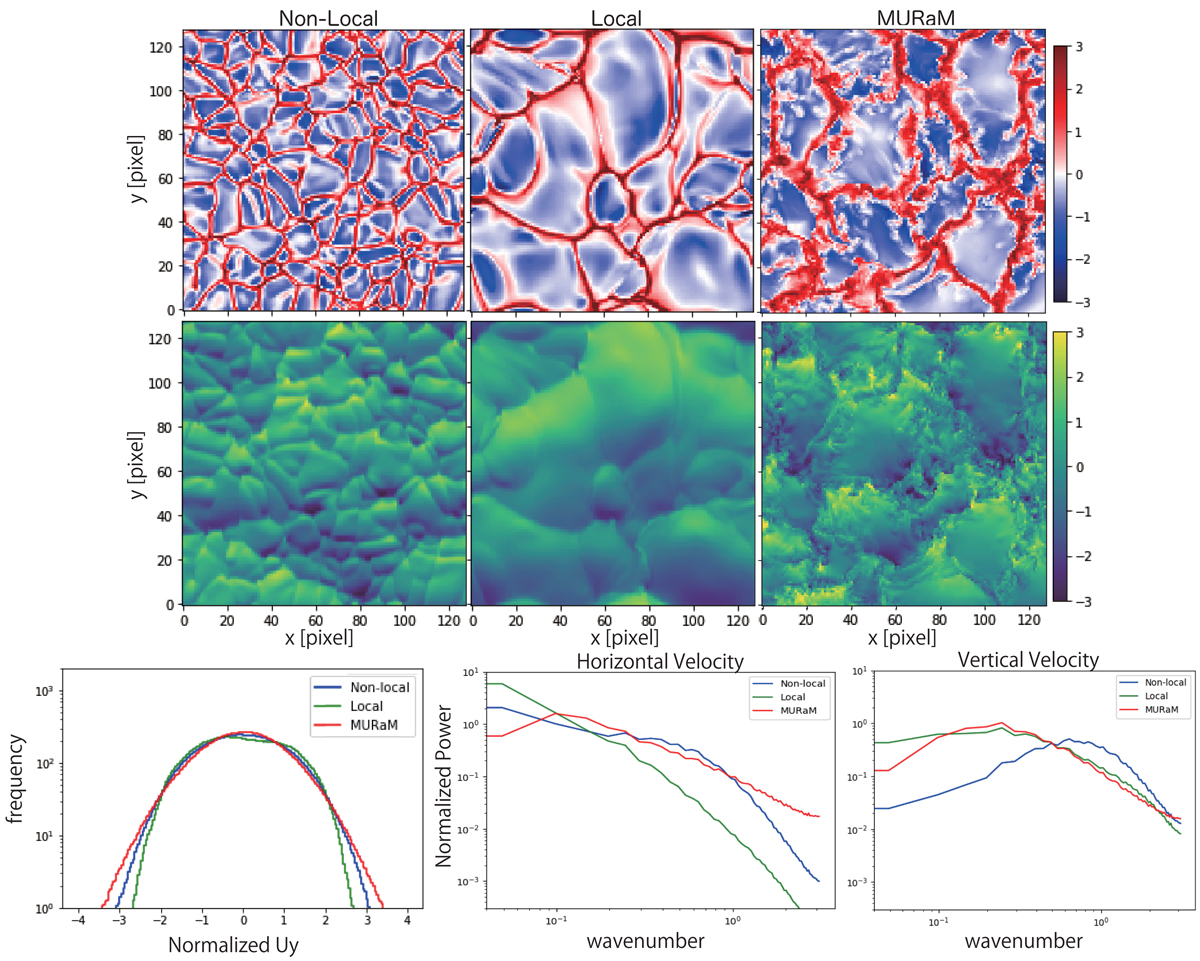
Representation of the training data sets. The spatial distributions of the vertical velocities (top panels) and Y component of the horizontal velocities (middle panels) of the non-local (left), local (center), and MURaM (right) simulation data. The bottom panels show the probability density functions (left), power spectra of the horizontal velocities (center), and power spectra of the vertical velocities (right) of the three simulations. The vertical and horizontal velocities in the simulations are normalized with zero and unit dispersion. This satisfies Eq. (3).
Current usage metrics show cumulative count of Article Views (full-text article views including HTML views, PDF and ePub downloads, according to the available data) and Abstracts Views on Vision4Press platform.
Data correspond to usage on the plateform after 2015. The current usage metrics is available 48-96 hours after online publication and is updated daily on week days.
Initial download of the metrics may take a while.