Fig. 42.
Download original image
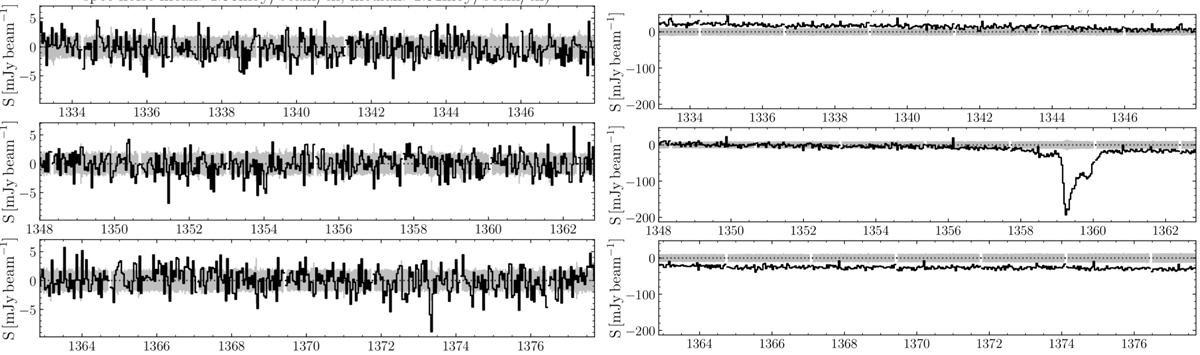
Two continuum-subtracted spectra extracted from data cubes produced by the imaging pipeline (see Adams et al., in prep. for details) against radio continuum sources of very different flux density. The source on the left has a flux density of ∼20 mJy, while the flux density of the source on the right is ∼2900 mJy. The horizontal axis is frequency covered by the corresponding cube. In both spectra, redshifted H I absorption is detected. Given the high flux density of the source on the right, the flatness of the spectra illustrates the good quality of the bandpass calibration that can be achieved even for bright radio sources. The offsets in the spectra relative to the zero intensity line are due to limitations in the continuum subtraction in the present version of the imaging pipeline.
Current usage metrics show cumulative count of Article Views (full-text article views including HTML views, PDF and ePub downloads, according to the available data) and Abstracts Views on Vision4Press platform.
Data correspond to usage on the plateform after 2015. The current usage metrics is available 48-96 hours after online publication and is updated daily on week days.
Initial download of the metrics may take a while.