Fig. 40.
Download original image
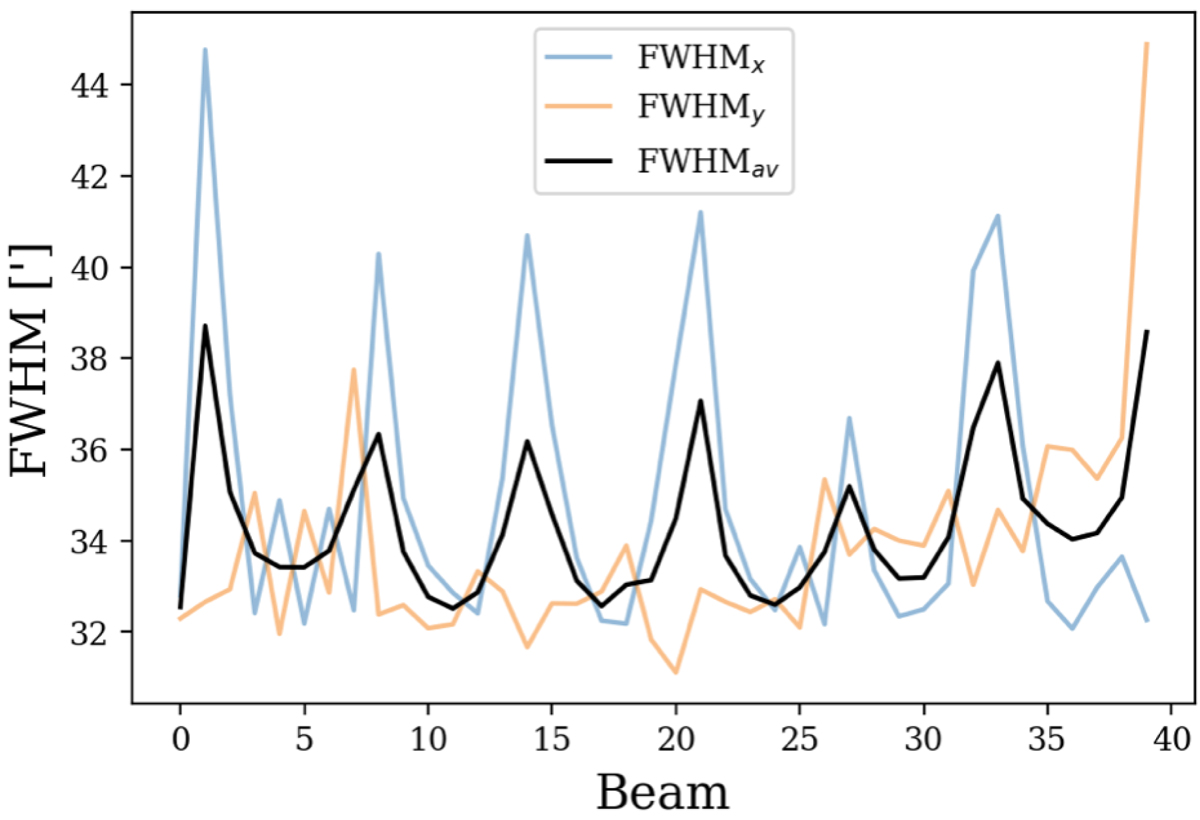
FWHM as a function of beam number for a frequency of 1363 MHz. The black line shows the average FWHM when fitting a two-dimensional Gaussian function to the beam maps. The blue line shows the FWHM of the one-dimensional Gaussian along the major axis, and the orange line shows the FWHM along the minor axis. The shape of the CBs is not perfectly Gaussian, but a two-dimensional Gaussian function is a good approximation for the beam shapes within a few percent.
Current usage metrics show cumulative count of Article Views (full-text article views including HTML views, PDF and ePub downloads, according to the available data) and Abstracts Views on Vision4Press platform.
Data correspond to usage on the plateform after 2015. The current usage metrics is available 48-96 hours after online publication and is updated daily on week days.
Initial download of the metrics may take a while.