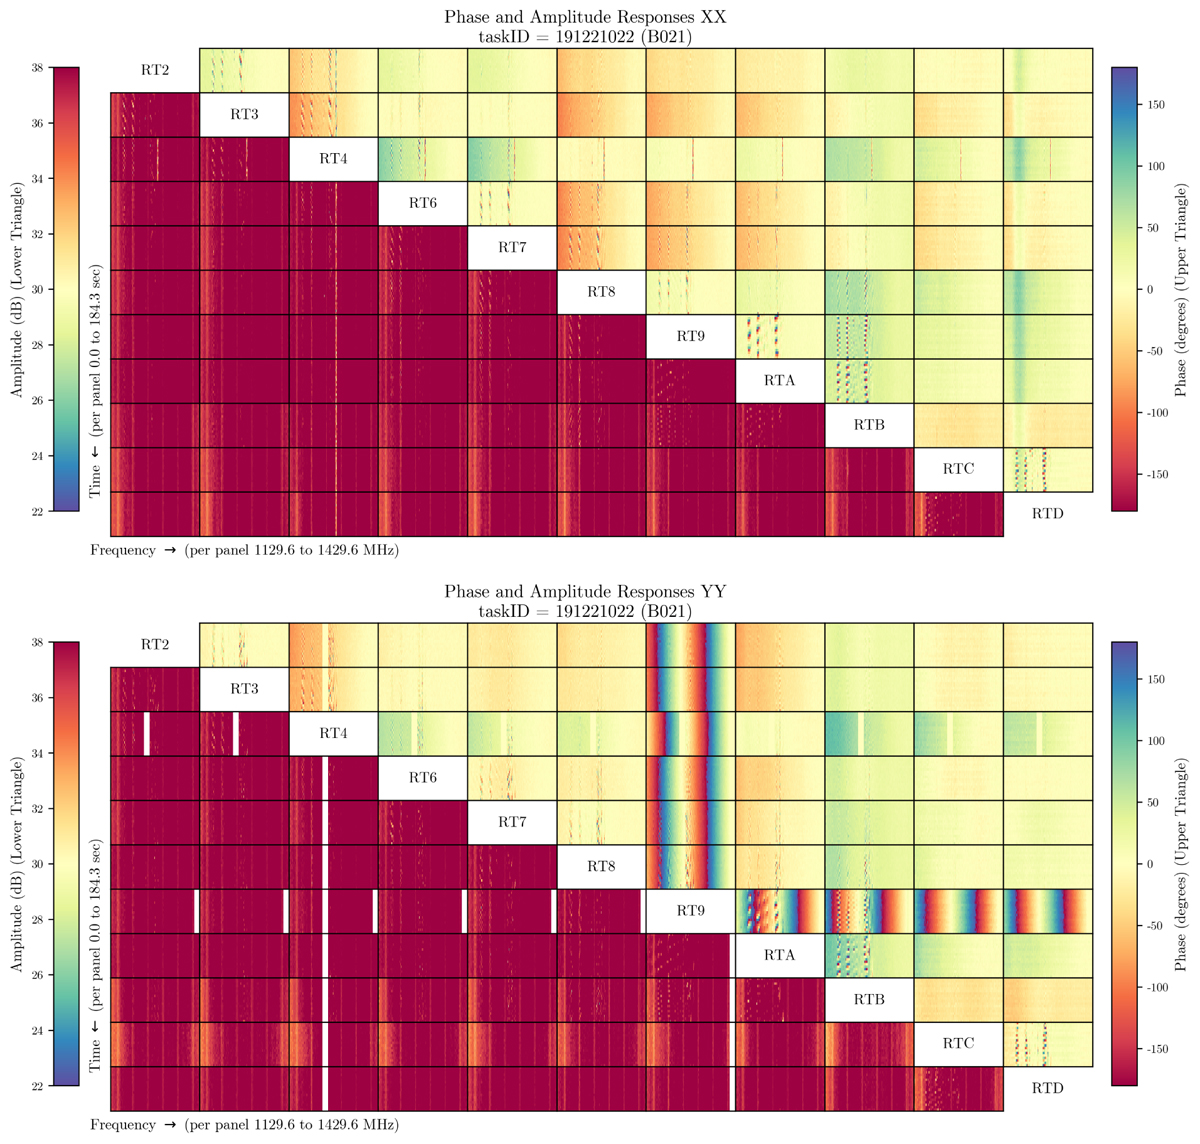
Fig. 34.
Download original image
Waterfall plots (time vs. frequency) of amplitude (lower left) and phase (upper right). Each baseline is shown for a single beam; for survey fields the central beam is shown and for calibrator observations the beam containing the calibrator is shown. A plot is made for both XX (upper image) and YY (lower image). These plots provide an initial check on data quality, especially the system tuning. RT9 has poor tuning in the YY polarisation; this is due to the missing data in the frequency range used for tuning.
Current usage metrics show cumulative count of Article Views (full-text article views including HTML views, PDF and ePub downloads, according to the available data) and Abstracts Views on Vision4Press platform.
Data correspond to usage on the plateform after 2015. The current usage metrics is available 48-96 hours after online publication and is updated daily on week days.
Initial download of the metrics may take a while.