Free Access
Fig. 2.
Download original image
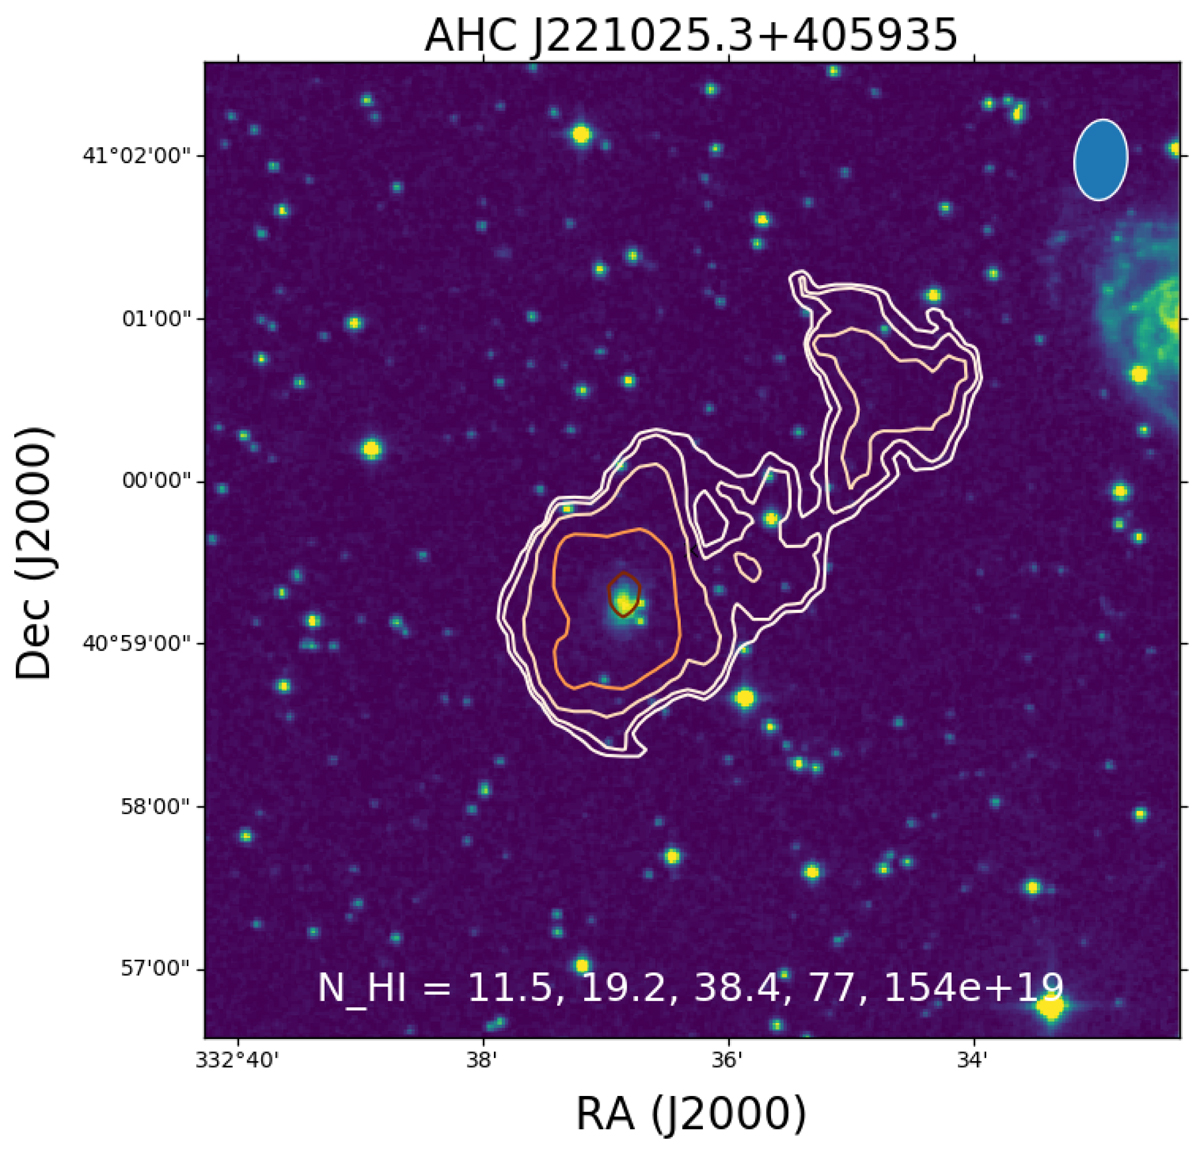
Example of H I emission (contours) detected in a small galaxy group (colour scale) in one of the Apertif pointings of the H I wide-area survey (Hess et al., in prep.). The contour levels correspond to 3, 5, 10, 20, and 40 times the noise level.
Current usage metrics show cumulative count of Article Views (full-text article views including HTML views, PDF and ePub downloads, according to the available data) and Abstracts Views on Vision4Press platform.
Data correspond to usage on the plateform after 2015. The current usage metrics is available 48-96 hours after online publication and is updated daily on week days.
Initial download of the metrics may take a while.