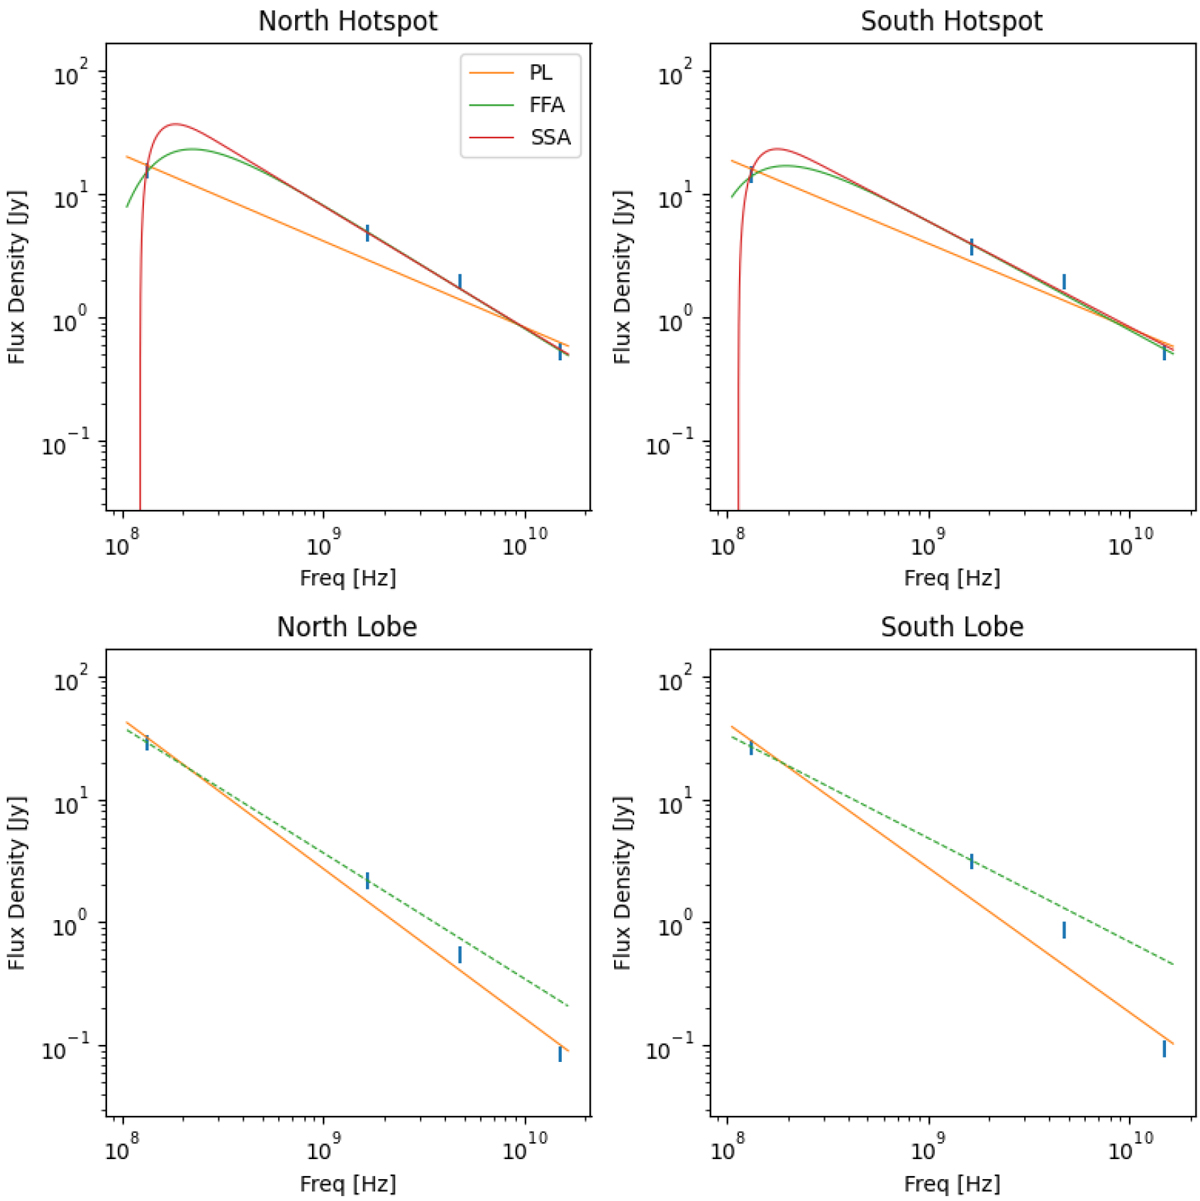
Fig. 5
Download original image
Per-component spectral fitting, using synchrotron self-absorption, free-free absorption and simple power law models. The model colours are the same in all plots. The dashed line in the lobe plots represents a power-law fit done using only the two lowest-frequency data points.
Current usage metrics show cumulative count of Article Views (full-text article views including HTML views, PDF and ePub downloads, according to the available data) and Abstracts Views on Vision4Press platform.
Data correspond to usage on the plateform after 2015. The current usage metrics is available 48-96 hours after online publication and is updated daily on week days.
Initial download of the metrics may take a while.