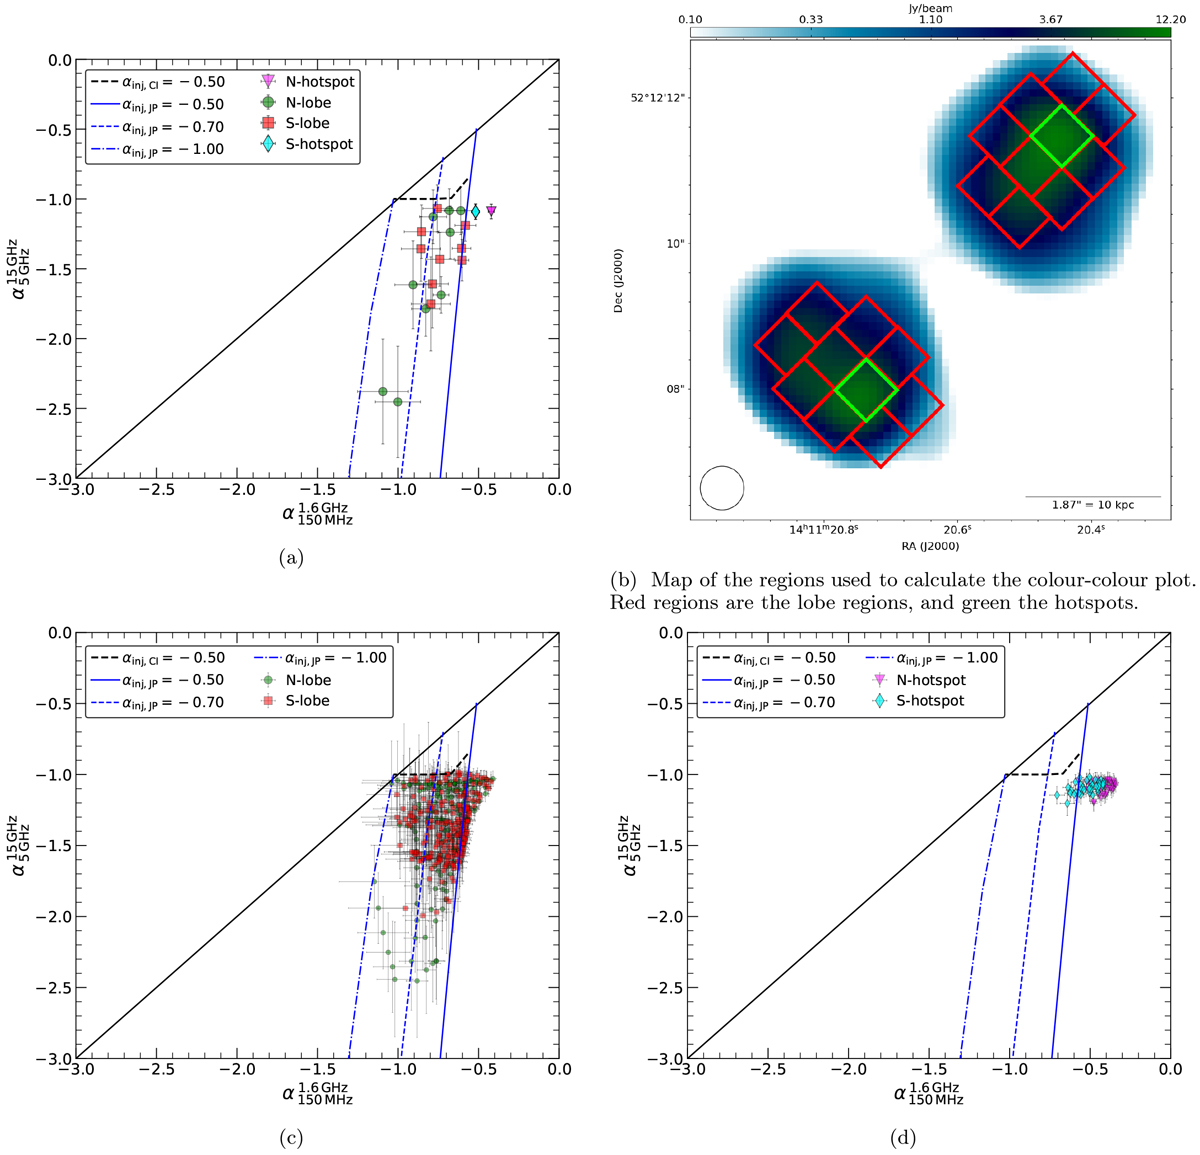
Fig. 4
Download original image
Radio colour-colour plots of different regions of 3C295. The spectral index values of Fig. 3a are plotted in the x-axis and the values of Fig. 3c in the y-axis. Panel a: radio colour-colour plot of 3C295 overlaid with the JP and CI spectral aging models with different injection indices. The regions used for extracting the spectral indices are shown in Fig. 4b. The two North lobe outliers correspond to regions near the host galaxy. Panel b: per-pixel colour-colour map to the lobes of Fig. 3. We see that the emission is largely consistent with the JP model. Outliers are pixels which are near the hotspots, and therefore likely to be contaminated by hotspot regions. Panel d: Per-pixel colour-colour plot of the hotspot data of Fig. 3. We see that the emission in hotspots is inconsistent with all three ageing models.
Current usage metrics show cumulative count of Article Views (full-text article views including HTML views, PDF and ePub downloads, according to the available data) and Abstracts Views on Vision4Press platform.
Data correspond to usage on the plateform after 2015. The current usage metrics is available 48-96 hours after online publication and is updated daily on week days.
Initial download of the metrics may take a while.