Fig. 8.

Download original image
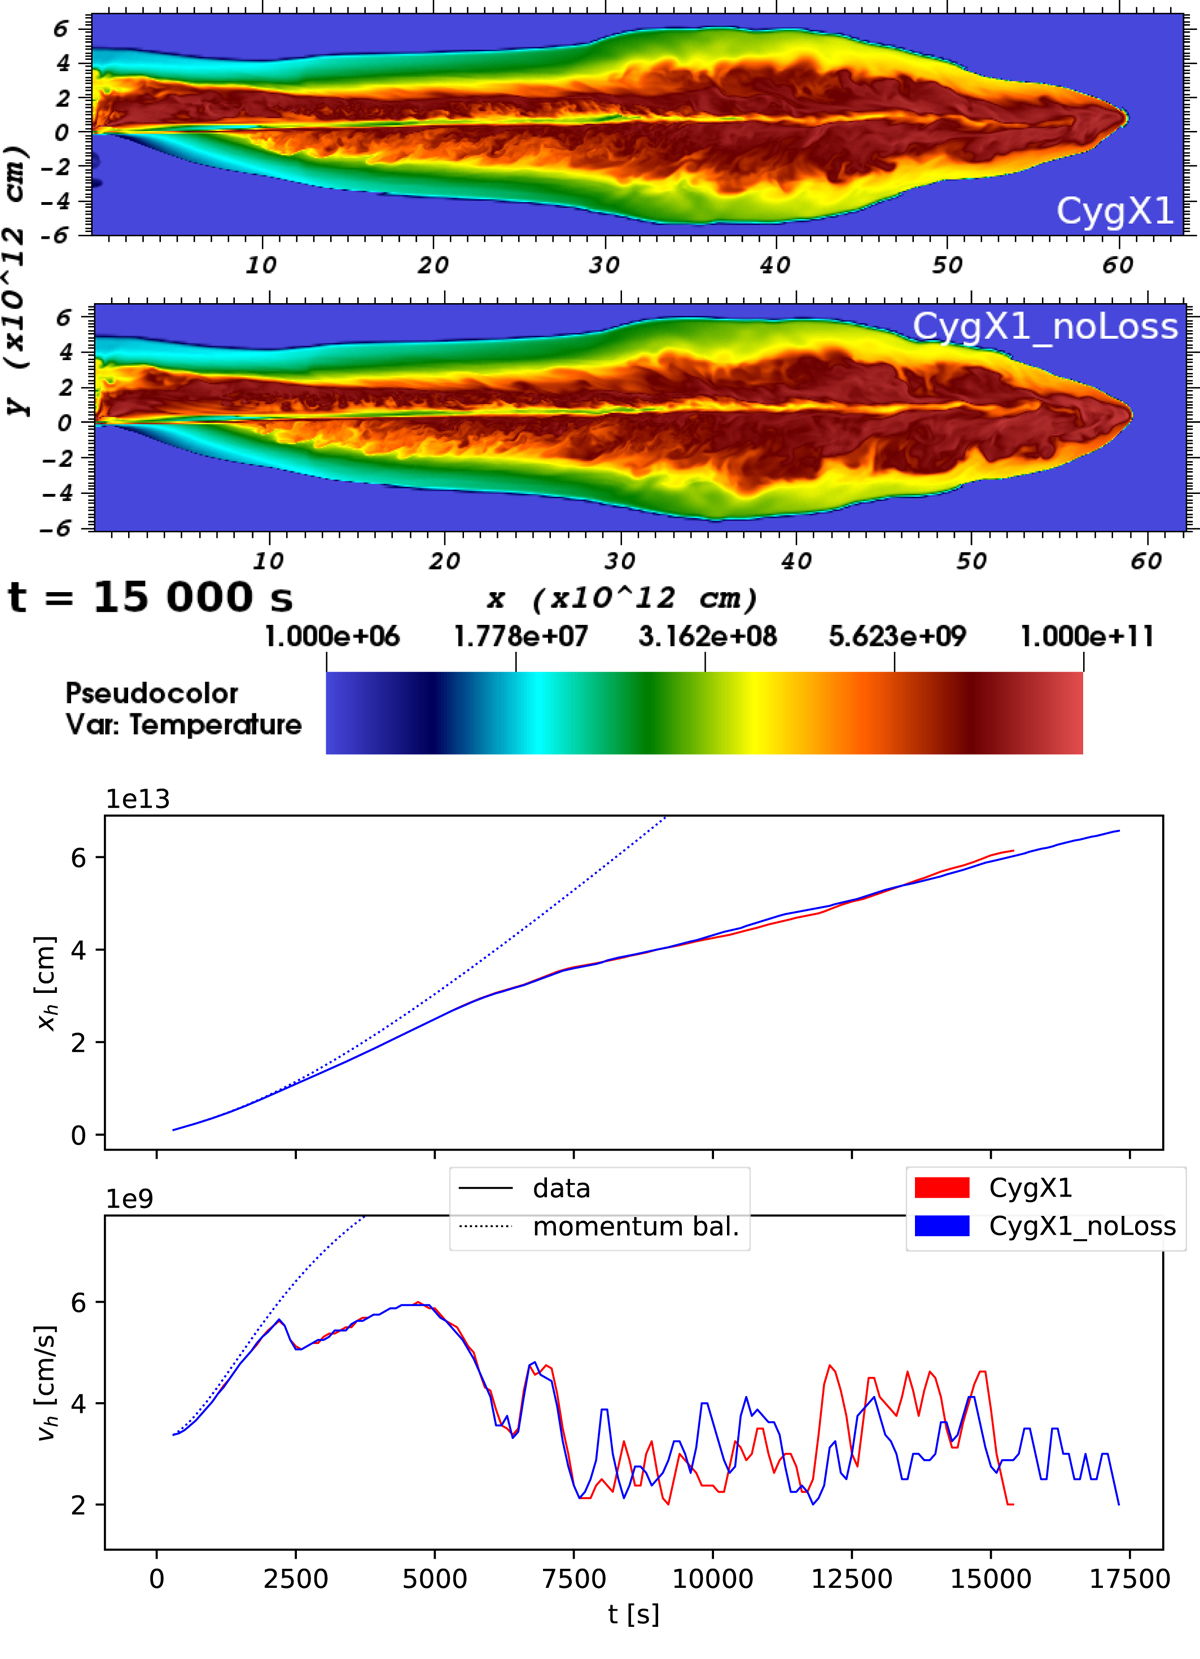
Effects of losses on run CygX1 structure and dynamics. Top: temperature slices of runs CygX1 and CygX1_noLoss at time t = 15 000 s. Both jets display similar structures, with the exception of a slightly larger outer cocoon at the head of the non-cooled jet. Bottom: jet head propagation and speed of the same runs, CygX1 in red and CygX1_noLoss in blue. The theoretical 1D propagation from Appendix A.1 is drawn as dotted lines following the same color-coding. The propagation is identical in both runs until the start of the turbulent phase, after which speed fluctuations differ, but the average propagation speed is identical in the two runs with almost no difference in the jet head position plot.
Current usage metrics show cumulative count of Article Views (full-text article views including HTML views, PDF and ePub downloads, according to the available data) and Abstracts Views on Vision4Press platform.
Data correspond to usage on the plateform after 2015. The current usage metrics is available 48-96 hours after online publication and is updated daily on week days.
Initial download of the metrics may take a while.


