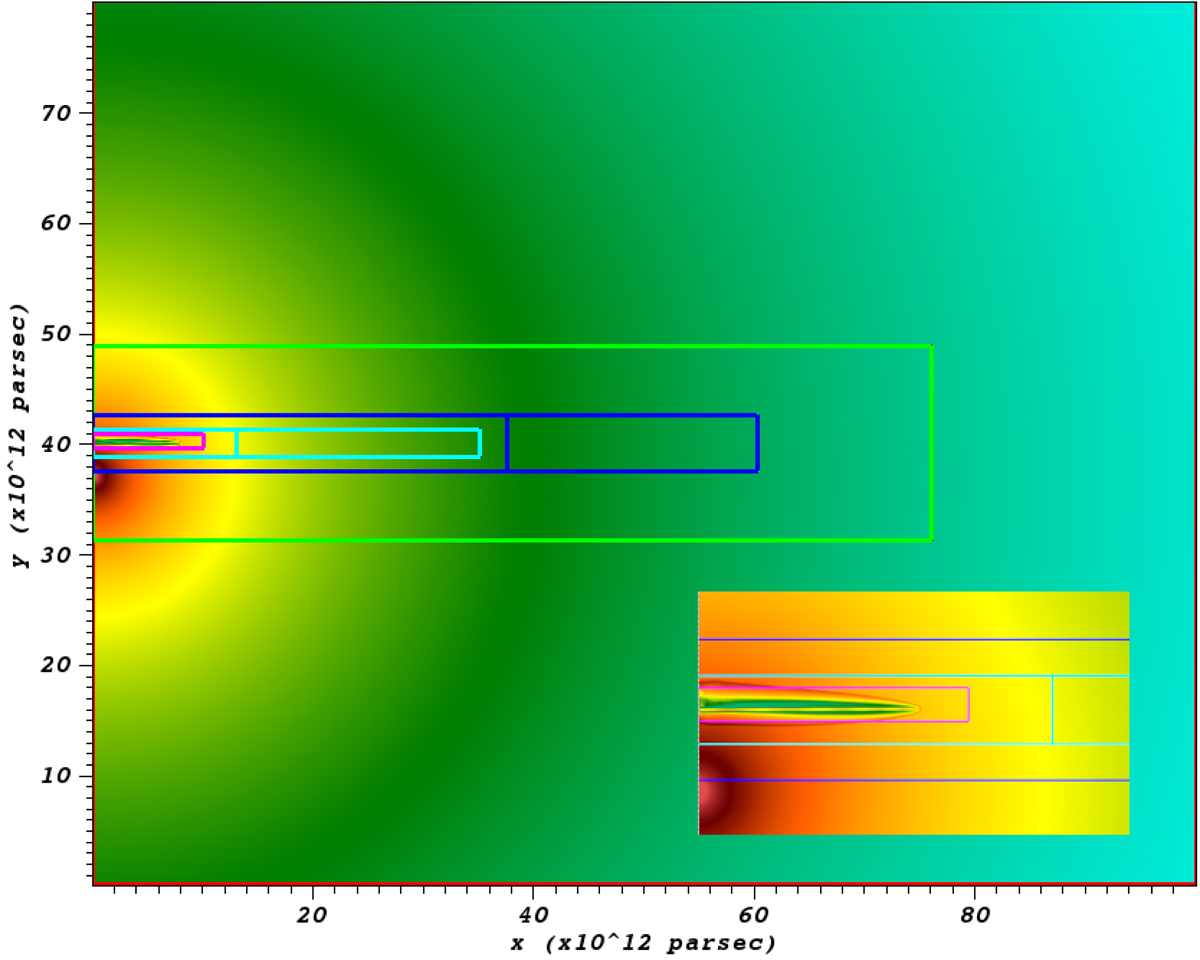
Fig. 2.

Download original image
Structure of the computational grid over the whole domain, illustrated for a rest mass density slice along the plane containing the star and jet center. The density scale extends from 10−19 (deep blue) to 10−12 g cm−3 (red), same as Fig. 3. The grid contains five refinement levels: the whole domain is refined twice (green and blue interfaces) by a factor of 4 and then twice more (cyan and magenta interfaces) by a factor of 2 to attain a factor of 64 in the finest levels, which are better shown in the zoom into the jet injection at the orbital scale in the bottom right corner of the image.
Current usage metrics show cumulative count of Article Views (full-text article views including HTML views, PDF and ePub downloads, according to the available data) and Abstracts Views on Vision4Press platform.
Data correspond to usage on the plateform after 2015. The current usage metrics is available 48-96 hours after online publication and is updated daily on week days.
Initial download of the metrics may take a while.


