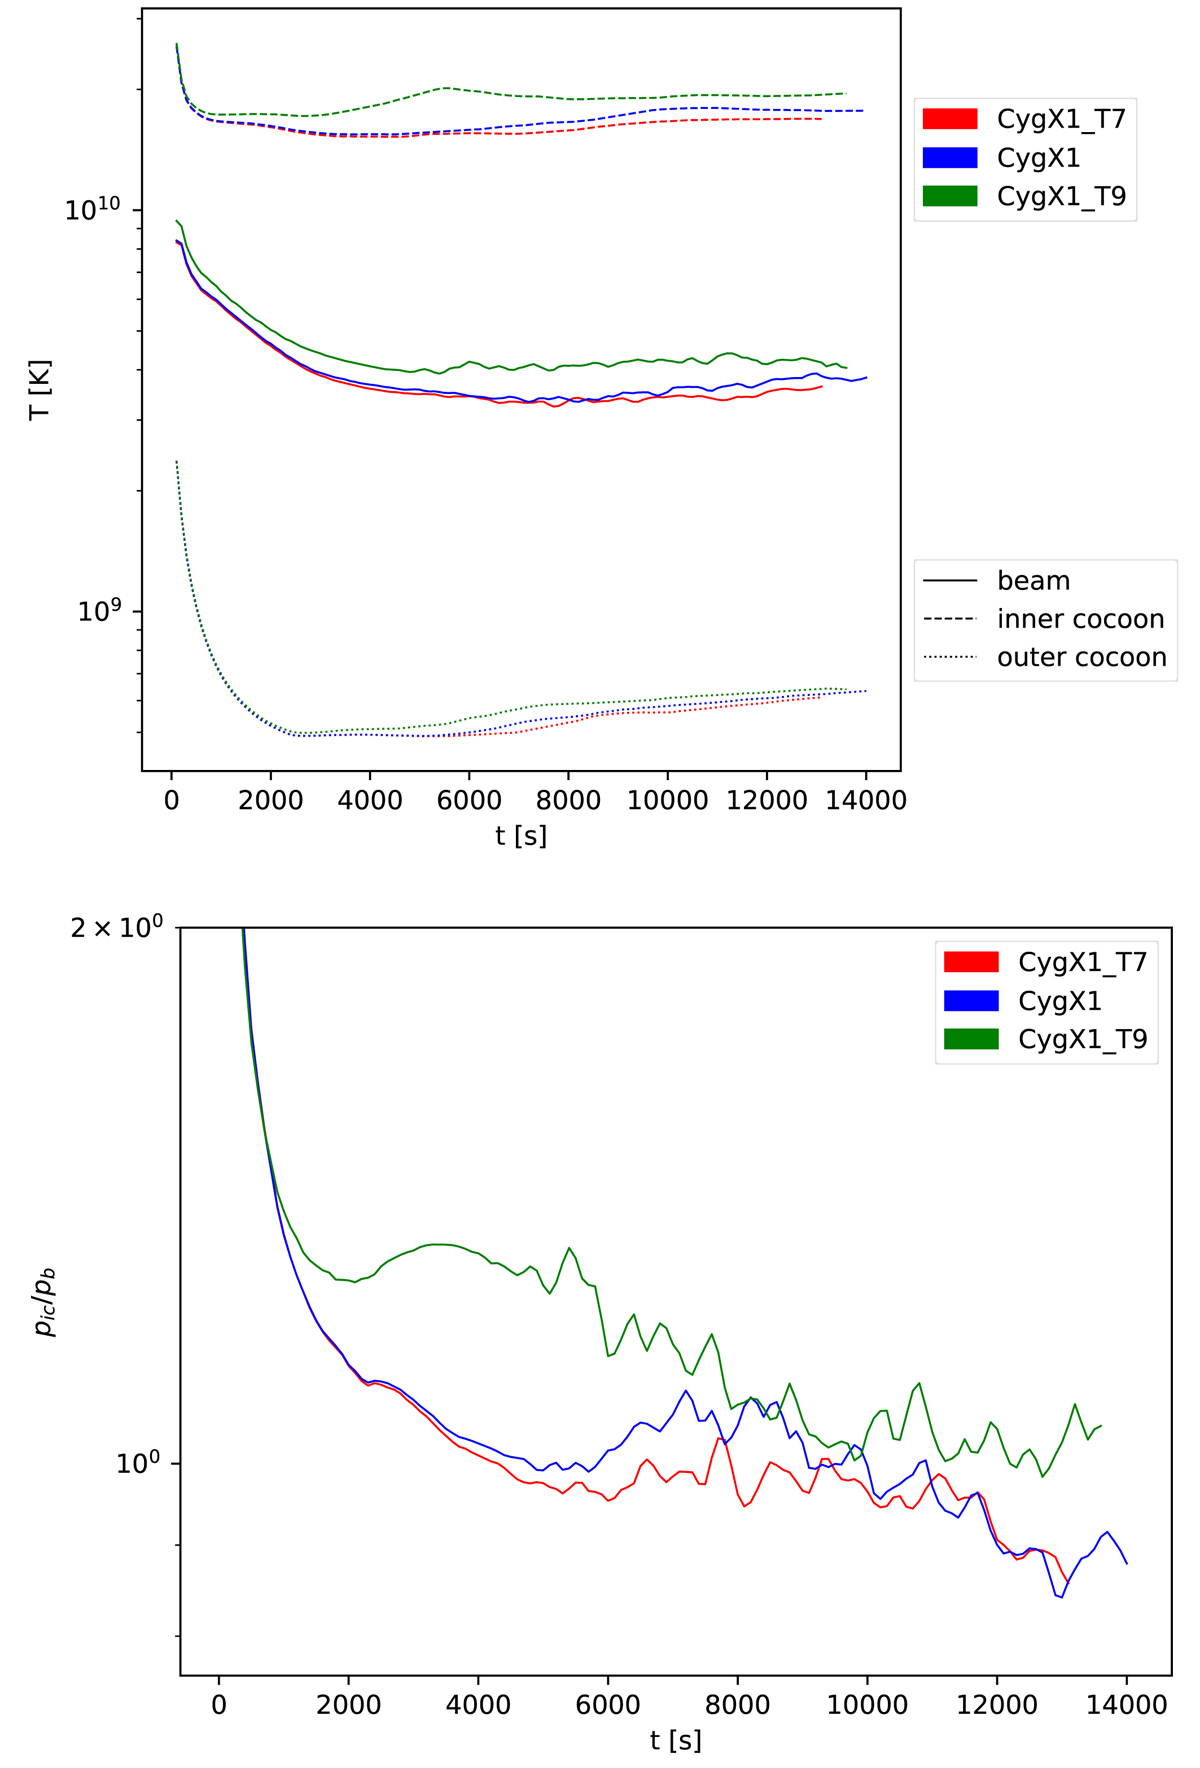
Fig. 13.

Download original image
Comparison of temperature and overpressure of runs CygX1_T7, CygX1 and CygX1_T9, the color-coding is the same as in Fig. 12. Top: evolution of the zone-averaged temperature with simulation time. CygX1 and CygX1_T7 differ only slightly at first, but then start to evolve differently after the 5000 s mark. CygX1_T9 shows an overall higher temperature, with a small peak in inner cocoon temperature around t = 6000 s. Bottom: evolution of the ratio of the inner cocoon to beam pressure, as defined Sect. 3.3.1. CygX1 and CygX1_T7 present similar values up to t ∼ 5000 s, while CygX1_T9 presents a stronger overpressure.
Current usage metrics show cumulative count of Article Views (full-text article views including HTML views, PDF and ePub downloads, according to the available data) and Abstracts Views on Vision4Press platform.
Data correspond to usage on the plateform after 2015. The current usage metrics is available 48-96 hours after online publication and is updated daily on week days.
Initial download of the metrics may take a while.


