Fig. 1.

Download original image
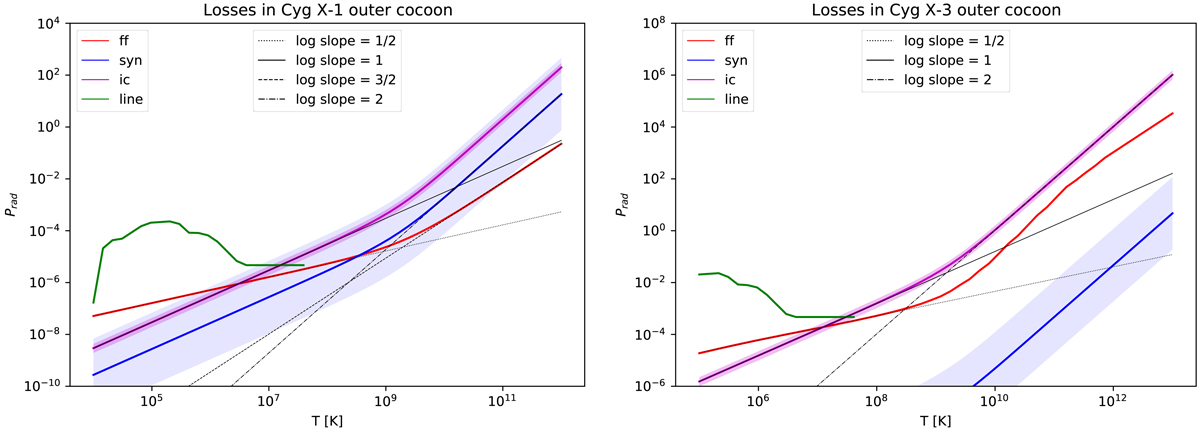
Evolution of the loss processes with rest frame temperature in Cygnus X-1 (left) and Cygnus X-3 (right). The thin black lines shows the various temperature scalings detailed Table B.1. Line recombination losses (“line”) are not drawn for T > 107.7 as they are disabled above this temperature. Colored shading shows synchrotron losses (“syn”) when the stellar magnetic field B⋆ is either multiplied or divided by 5, and the shading around inverse Compton losses (“ic”) illustrates a ±10% uncertainty on T⋆. The values for the physical quantities have been chosen in the outer cocoon leeward side in fiducial runs. They allow for a clear showcasing of the loss scaling, but are not representative of the losses over the simulation. We refer to Fig. 7 to compare them over the whole jet. For Cygnus X-1: ρ = 10−15 g cm−3, B⋆ = 10 G, T⋆ = 3 × 10⁴ K, (x, y, z) = (1.5 × 10¹², 4.05 × 10¹³, 4 × 10¹³) cm, (vx, vy, vz) = (108, 108, 108) cm s−1. For Cygnus X-3: ρ = 10−14 g cm−3, B⋆ = 100 G, T⋆ = 8 × 10⁴ K, (x, y, z) = (1.5 × 10¹², 3.05 × 10¹³, 3 × 10¹³) cm, (vx, vy, vz) = (108, 5 × 10⁸, −103) cm s−1.
Current usage metrics show cumulative count of Article Views (full-text article views including HTML views, PDF and ePub downloads, according to the available data) and Abstracts Views on Vision4Press platform.
Data correspond to usage on the plateform after 2015. The current usage metrics is available 48-96 hours after online publication and is updated daily on week days.
Initial download of the metrics may take a while.


