Fig. 4.
Download original image
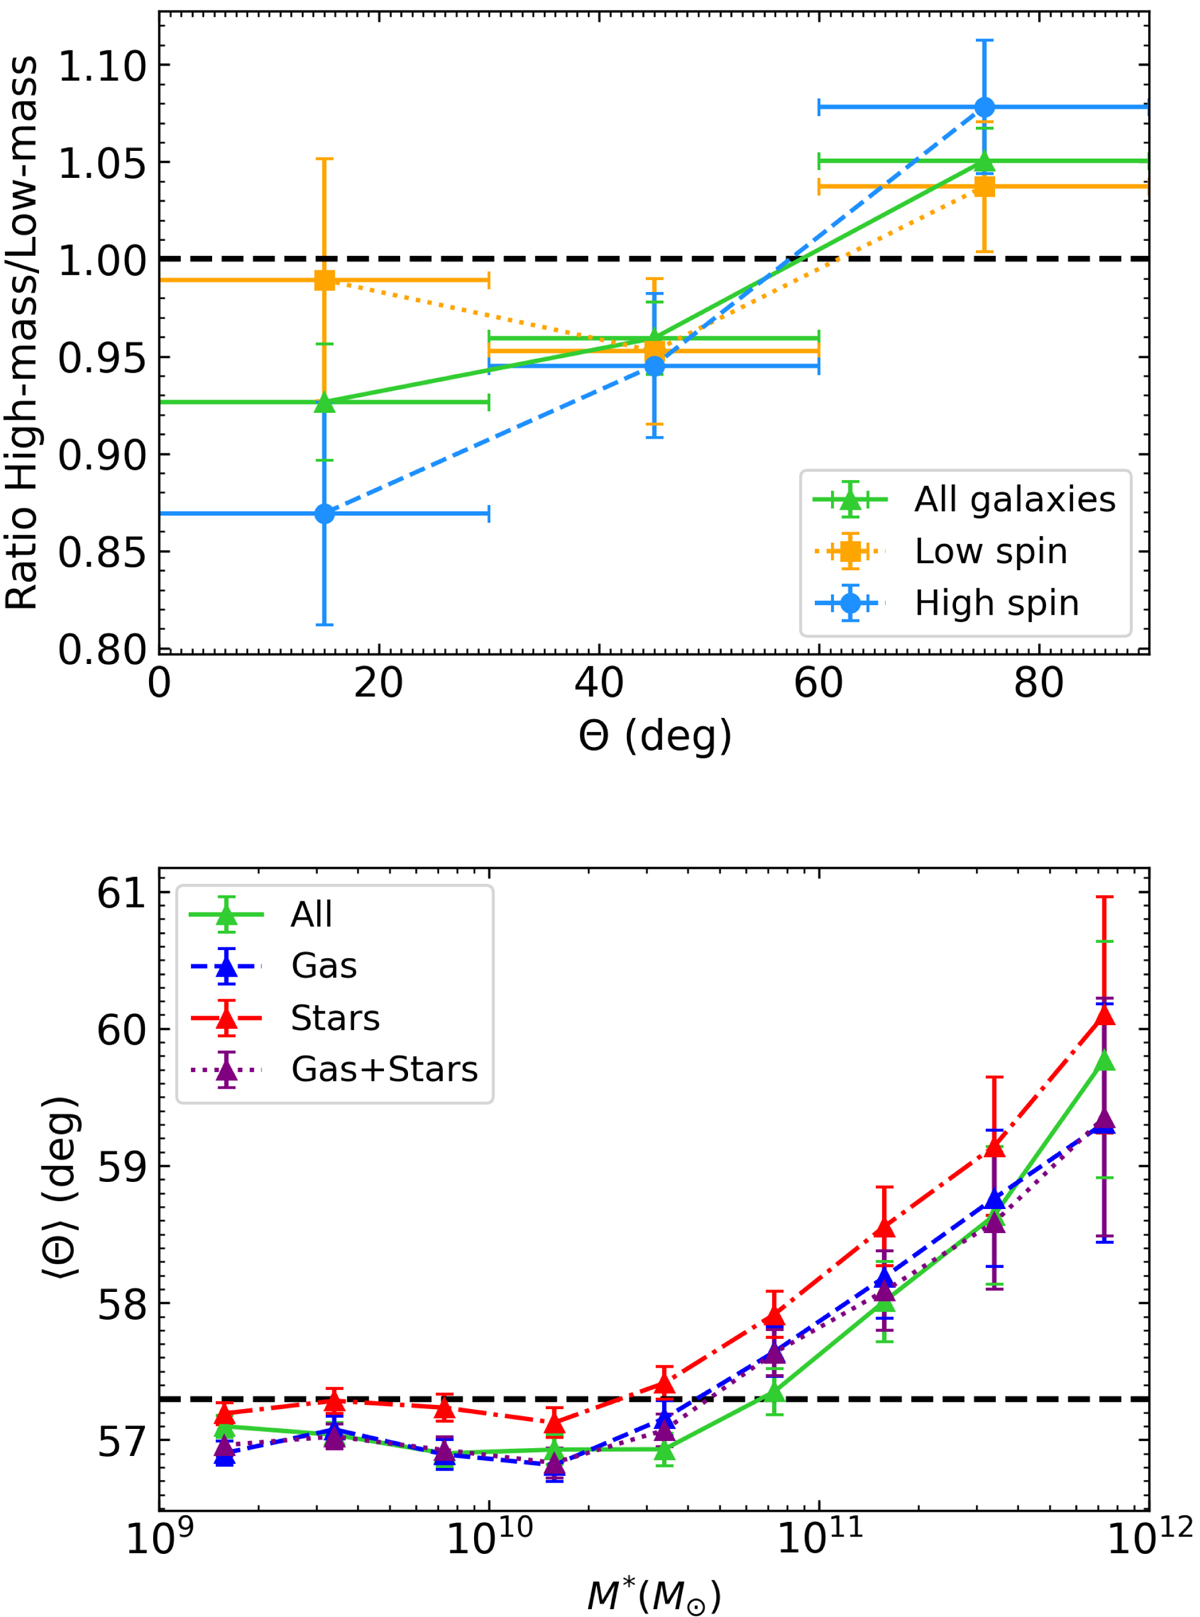
Detection of a spin alignment transition mass in IllustrisTNG. Top panel: ratio of the distribution of θ values (binned in three bins corresponding to parallel and perpendicular orientations and to no preferential orientation) as derived for the high-mass and the low-mass galaxies (only jtot is considered). The green line shows the ratio of high-mass to low-mass θ distributions for all the galaxies, the dotted orange line shows the ratio for low-spin parameter galaxies, and the dashed cyan line shows the ratio for high-spin parameter galaxies as defined with the percentiles of the Bullock parameter distribution. Bottom panel: average angle θ computed in bins of stellar mass. The dashed black line is ![]() given by Eq. (3) for the total subhalo sample. The coloured lines are the distributions for the spin measured with different components (solid green: jtot, dashed blue: jgas, dot-dashed red: jstars, and dotted purple: jgas + stars).
given by Eq. (3) for the total subhalo sample. The coloured lines are the distributions for the spin measured with different components (solid green: jtot, dashed blue: jgas, dot-dashed red: jstars, and dotted purple: jgas + stars).
Current usage metrics show cumulative count of Article Views (full-text article views including HTML views, PDF and ePub downloads, according to the available data) and Abstracts Views on Vision4Press platform.
Data correspond to usage on the plateform after 2015. The current usage metrics is available 48-96 hours after online publication and is updated daily on week days.
Initial download of the metrics may take a while.