Fig. 2.
Download original image
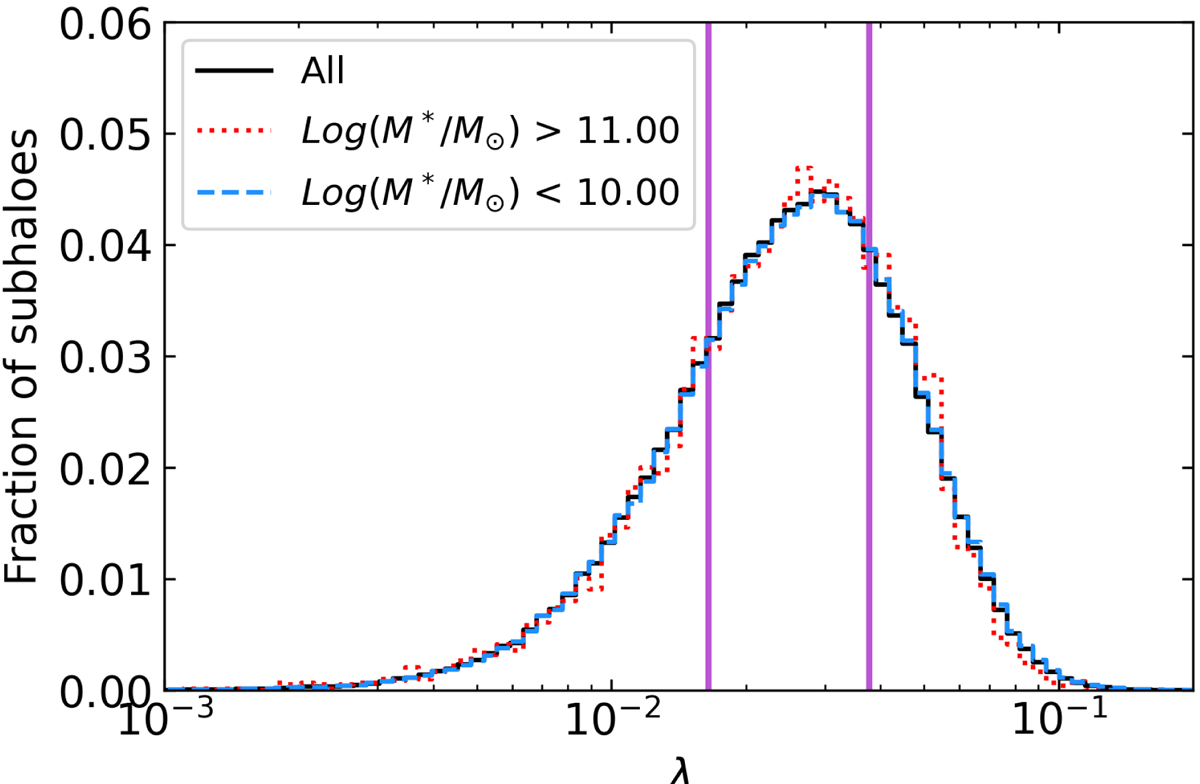
Distributions of the Bullock parameter λ as derived in Eq. (2). The black line refers to the total sample, the dotted red line refers to high-mass galaxies, and the dashed blue line refers to low-mass galaxies. The vertical purple lines are located at the 25th and 75th percentiles of the λ distribution and represent a qualitative distinction between high-spin parameter and low-spin parameter galaxies.
Current usage metrics show cumulative count of Article Views (full-text article views including HTML views, PDF and ePub downloads, according to the available data) and Abstracts Views on Vision4Press platform.
Data correspond to usage on the plateform after 2015. The current usage metrics is available 48-96 hours after online publication and is updated daily on week days.
Initial download of the metrics may take a while.