Fig. C.1.
Download original image
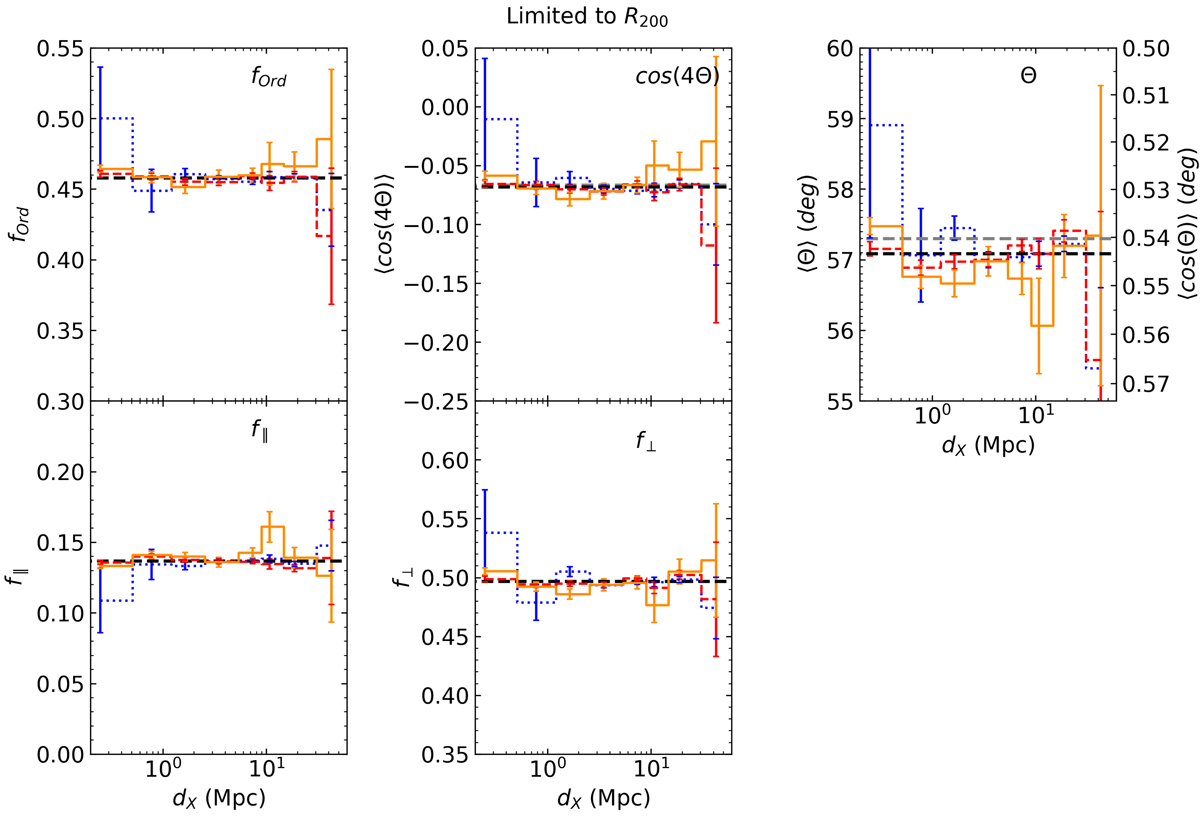
Distributions of ⟨θ⟩, ⟨cos(4θ)⟩, fraction of ordered galaxies (fOrd), fraction of parallel galaxies (f∥), and fraction of perpendicular galaxies (f⊥) as a function of the distances from the features of the cosmic web dfil (dashed red line in every panel), dCP (dotted blue line in every panel), and dskel (solid orange line in every panel). In the case of dCP and dskel, only galaxies outside of filaments (dfil ≥ 1 Mpc) and inside filaments (dfil ≤ 1 Mpc) have been considered, respectively. Error bars on the distributions have been computed through bootstrap resampling. The dashed black line in every panel is the average of the considered quantity in the full simulation box. In the top left and top middle panels, the grey line is ![]() and
and ![]() , computed given equations (3) and (4) for the total subhalo sample. In this figure, the spin j200 has been computed using only particles within the R200 of every subhalo. In every panel, the first distance bin considered extends all the way to 0 for all distances, but it is cut because the x-axis is in logarithmic scale. In the f∥ and f⊥ cases, the y-axes of the plots cover very different ranges.
, computed given equations (3) and (4) for the total subhalo sample. In this figure, the spin j200 has been computed using only particles within the R200 of every subhalo. In every panel, the first distance bin considered extends all the way to 0 for all distances, but it is cut because the x-axis is in logarithmic scale. In the f∥ and f⊥ cases, the y-axes of the plots cover very different ranges.
Current usage metrics show cumulative count of Article Views (full-text article views including HTML views, PDF and ePub downloads, according to the available data) and Abstracts Views on Vision4Press platform.
Data correspond to usage on the plateform after 2015. The current usage metrics is available 48-96 hours after online publication and is updated daily on week days.
Initial download of the metrics may take a while.