Fig. B.2.
Download original image
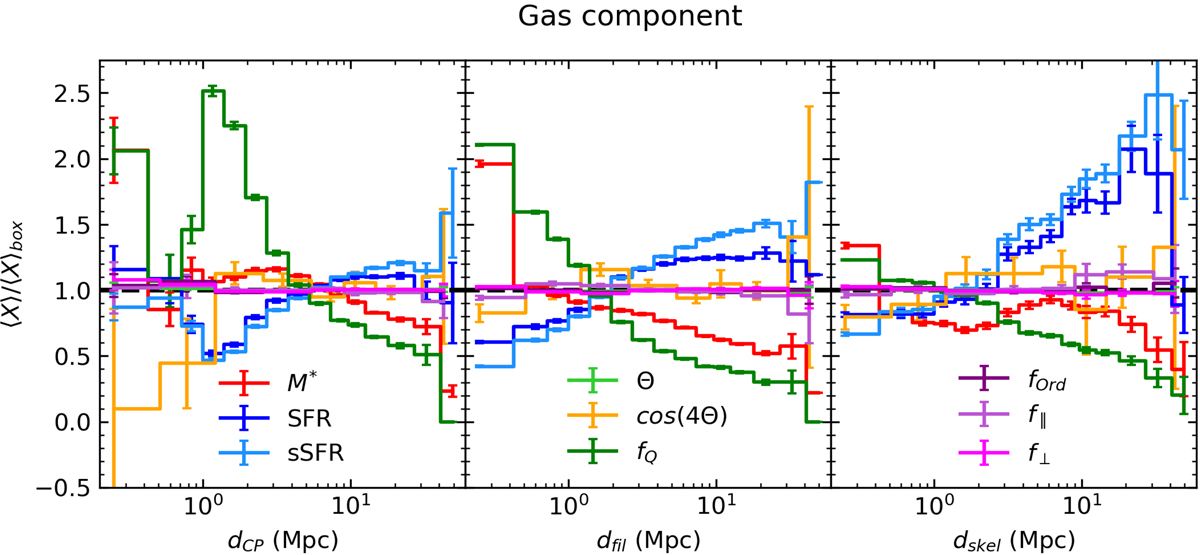
Normalised distributions (expressed as ![]() ) with respect to distances dCP (left panel), dfil (middle panel), and dskel (right panel). The quantities considered in each panel (⟨X⟩) are respectively: ⟨M*⟩ (red), ⟨SFR⟩ (dark blue), ⟨sSFR⟩ (light blue), ⟨θ⟩ (light green), ⟨cos(4θ)⟩ (orange), fQ (dark green), fOrd (dark purple), f∥ (light purple), and f⊥ (magenta). ⟨X⟩ indicates the average of the quantity taken including all subhaloes in the box (for dfil), only those outside filaments (dCP), and only those inside filaments (dskel) over the full simulation volume. Only the gas component is used to compute spin-related quantities. In every panel, the first distance bin considered extends all the way to zero for all distances, but it is cut because the x-axis is in logarithmic scale.
) with respect to distances dCP (left panel), dfil (middle panel), and dskel (right panel). The quantities considered in each panel (⟨X⟩) are respectively: ⟨M*⟩ (red), ⟨SFR⟩ (dark blue), ⟨sSFR⟩ (light blue), ⟨θ⟩ (light green), ⟨cos(4θ)⟩ (orange), fQ (dark green), fOrd (dark purple), f∥ (light purple), and f⊥ (magenta). ⟨X⟩ indicates the average of the quantity taken including all subhaloes in the box (for dfil), only those outside filaments (dCP), and only those inside filaments (dskel) over the full simulation volume. Only the gas component is used to compute spin-related quantities. In every panel, the first distance bin considered extends all the way to zero for all distances, but it is cut because the x-axis is in logarithmic scale.
Current usage metrics show cumulative count of Article Views (full-text article views including HTML views, PDF and ePub downloads, according to the available data) and Abstracts Views on Vision4Press platform.
Data correspond to usage on the plateform after 2015. The current usage metrics is available 48-96 hours after online publication and is updated daily on week days.
Initial download of the metrics may take a while.