Open Access
Fig. A.1.
Download original image
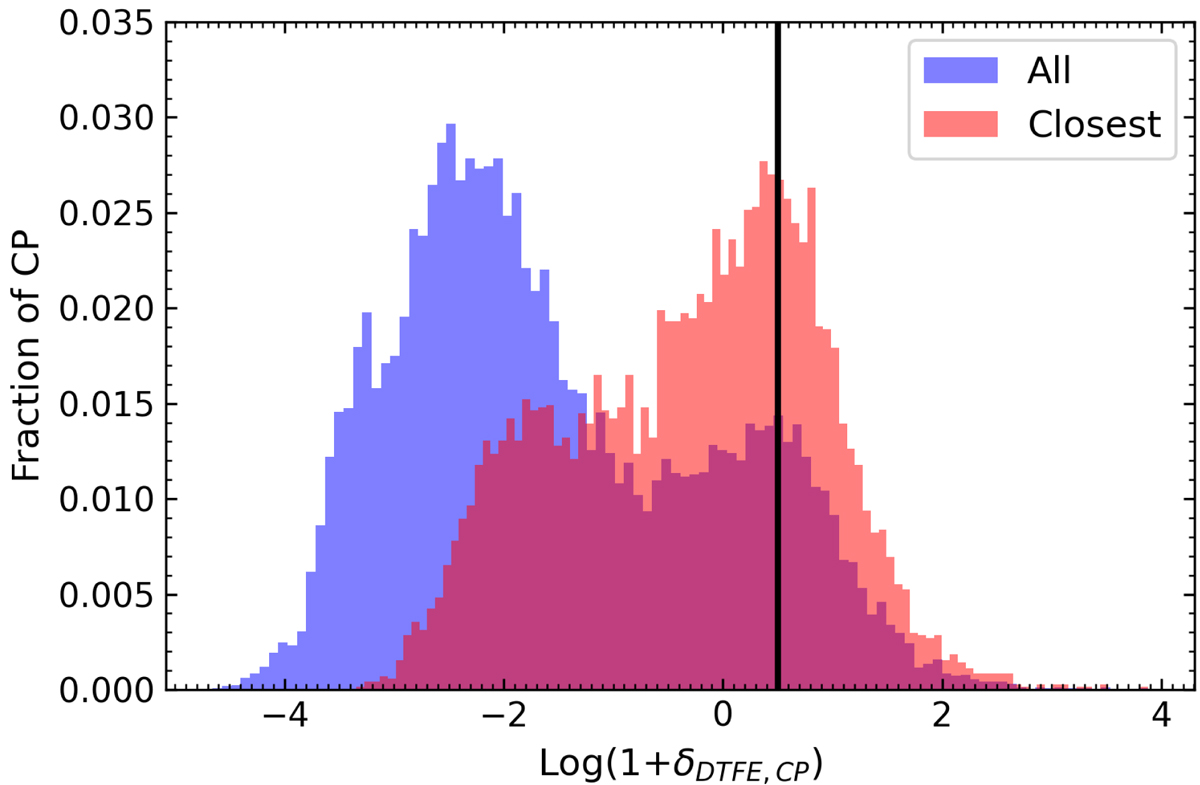
Density contrast distribution for all the critical points in the simulation box (blue) and those identified as closest to at least a subhalo (only maxima and bifurcations considered, in red) when performing the measurement of dCP. The vertical black line shows the threshold in critical point density contrast we adopted.
Current usage metrics show cumulative count of Article Views (full-text article views including HTML views, PDF and ePub downloads, according to the available data) and Abstracts Views on Vision4Press platform.
Data correspond to usage on the plateform after 2015. The current usage metrics is available 48-96 hours after online publication and is updated daily on week days.
Initial download of the metrics may take a while.