Fig. 7
Download original image
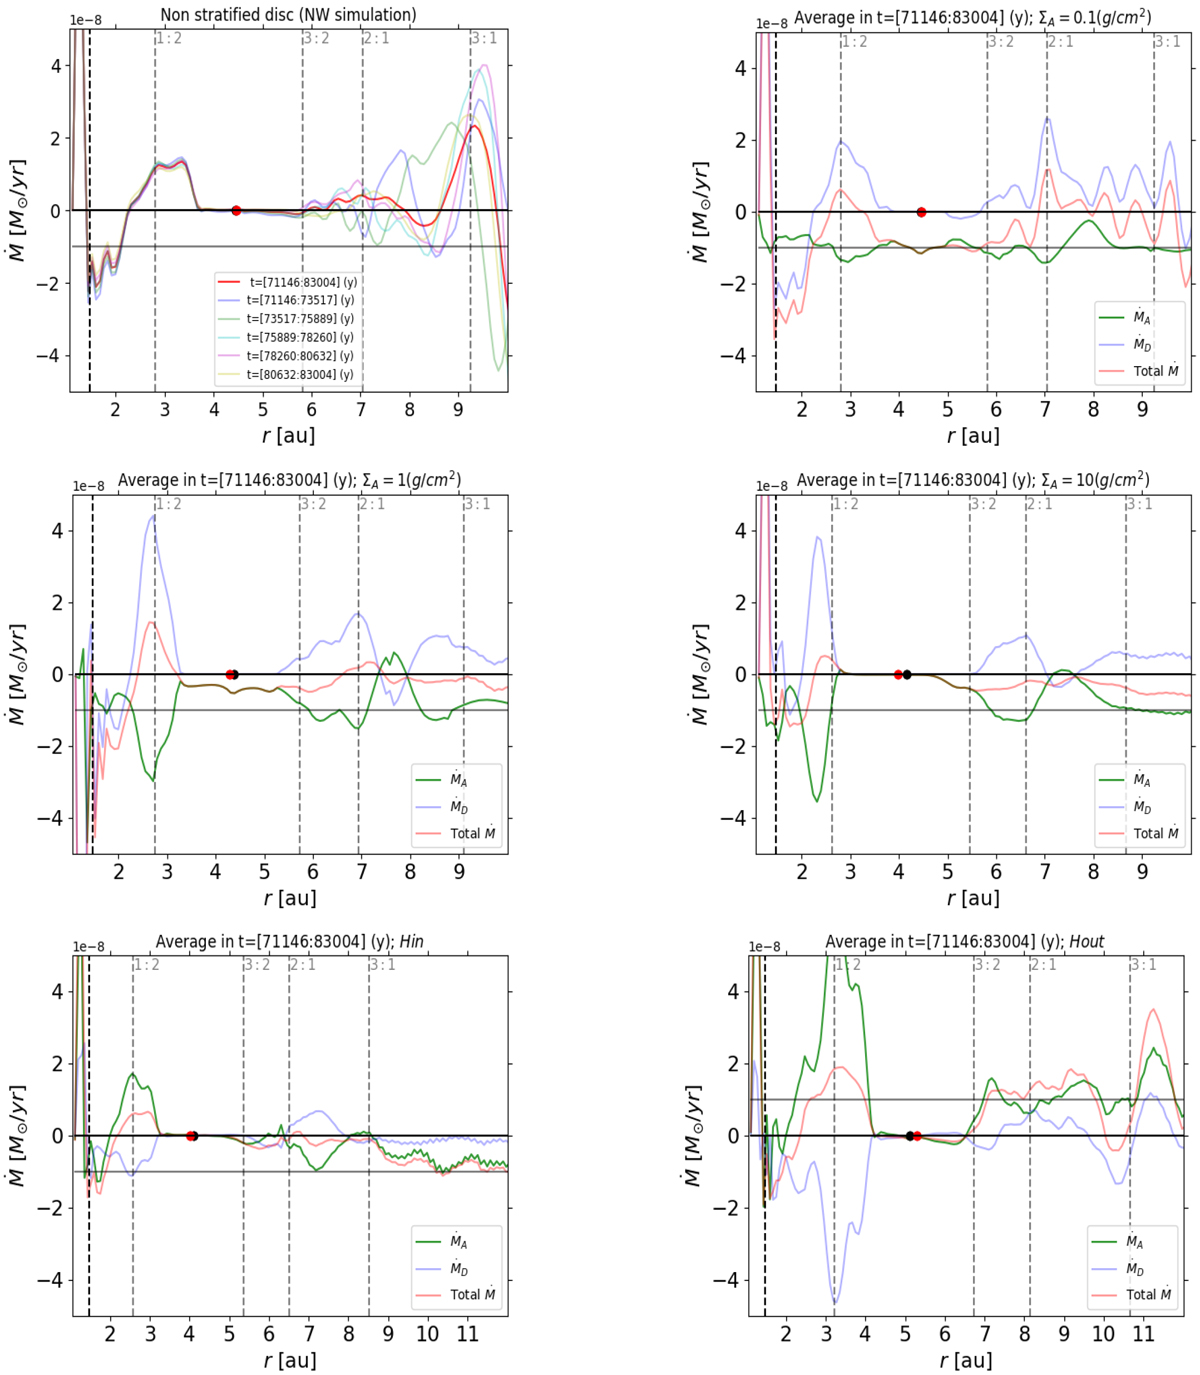
Total mass flow transported through the disc (red curve). A temporal average over 1000 outputs (spaced by Δt = 11.85 yr) has been performed in order to smooth fluctuations. For the non-stratified case (top left panel) we have split the averaging interval into five parts. We show the five averages to illustrate the time variations of the flow (see text). In the averaging time interval the planet is migrating outwards for simulations NW, S01 and Hout and is migrating inwards for the cases with thicker active layers: S1 and S10 and for simulation set Hin. The black and red filled circles at Ṁ = 0 indicate the planet–star distance respectively at the beginning and at the end of the averaging interval. For the stratified disc models the contribution from the active layers (green curve) as well as the one fromthe dead region of the disc (blue curve) are also plotted. Notice that for simulations Hin and Hout we apply thesynthetic torque in the region between the midplane and z = H (active layers); while for z > H no torque is applied (dead layers). The grey horizontal line at Ṁ = ∓ 10−8 M⊙ yr−1 indicates the expected flow transported by the active layers (the sign plus is for simulation set Hout). The vertical dotted grey lines provide the location of the main mean motion resonances computed using the planet position at t = 71 146 yr. The evanescent boundary condition is applied in the domain inside the vertical black dotted line at 1.25 au.
Current usage metrics show cumulative count of Article Views (full-text article views including HTML views, PDF and ePub downloads, according to the available data) and Abstracts Views on Vision4Press platform.
Data correspond to usage on the plateform after 2015. The current usage metrics is available 48-96 hours after online publication and is updated daily on week days.
Initial download of the metrics may take a while.