Fig. B.1
Download original image
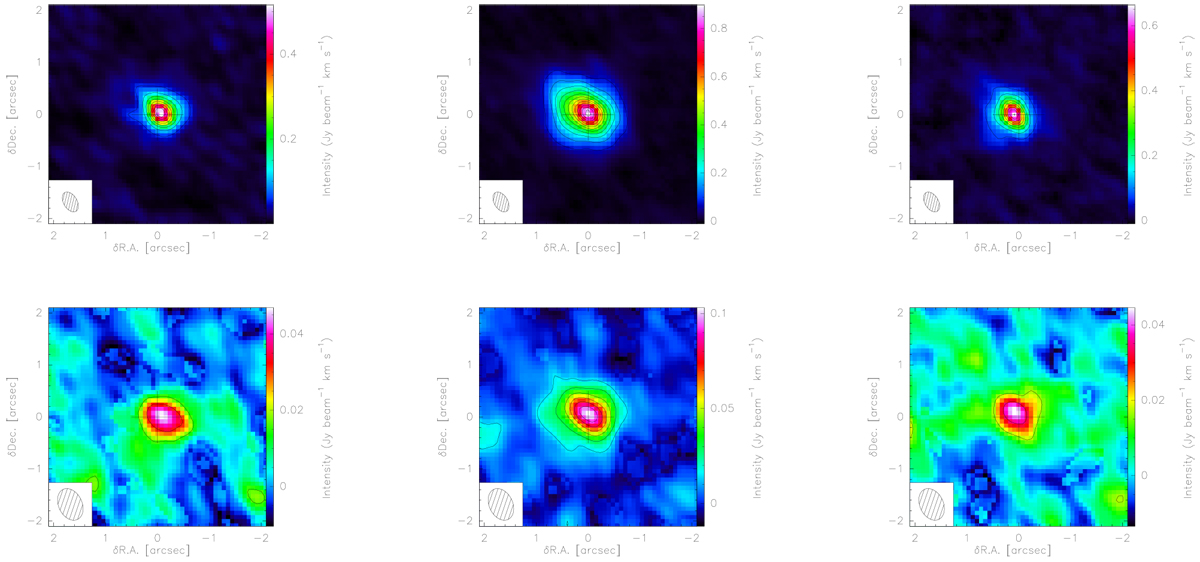
Velocity-integrated intensity maps of the HCN(3-2) (upper row) and H13CN(3-2) lines (lower row), covering three velocity intervals. Left: Blue line wing [vlsr,* − 10,vlsr,* − 2] km s−1, Middle: line center [vlsr,* − 2,vlsr,* + 2] km s−1, Right: Red line wing [vlsr,* + 2,vlsr,* + 10] km s−1. North is up and east is to the left. We note the different color scales. Contours are plotted every 10σ for HCN andevery 3σ for H13CN, where (from left to right) 1σ = 5.7, 7.2, 7.2 mJy/beam km s−1 for HCN(3-2) and 1σ = 5.2, 5.0, 5.6 mJy/beam km s−1 for H13CN(3-2). The black ellipse in the lower left corner indicates the synthesized beam. We note that the HCN maps were produced using robust weighting, whereas for the H13CN maps, we applied natural weighting.
Current usage metrics show cumulative count of Article Views (full-text article views including HTML views, PDF and ePub downloads, according to the available data) and Abstracts Views on Vision4Press platform.
Data correspond to usage on the plateform after 2015. The current usage metrics is available 48-96 hours after online publication and is updated daily on week days.
Initial download of the metrics may take a while.