Fig. 25
Download original image
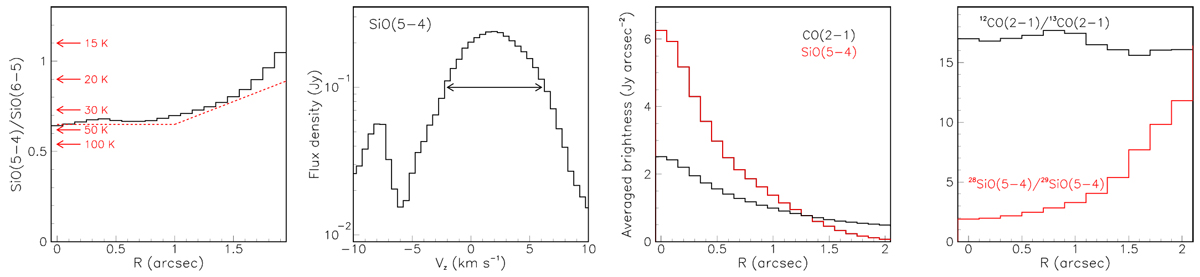
Analysis of SiO and comparison with CO. Left: ratio RT of SiO(5–4) to SiO(6–5) line emitted fluxes as a function of R for |vz | < 8 km s−1. Corresponding temperature values using the relation T[K] = 12.5∕(ln(RT) + 0.74 are shown in red on the scale of the ordinate. The red dashed line indicates constant RT of 0.64 (T ~ 42 K) for R ≤1′′ and a linear increase of RT to 0.89 (T ~ 20 K) from 1′′ to 2′′. Center-left: Doppler velocity spectrum of the SiO(5–4) data for R <0.1′′. Center-right: R distribution of the SiO(5–4) (red) and 12CO(2–1) (black) emission averaged over position angle ω, measured in Jy arcsec−2, and averaged over − 2 < vz < 6 km s−1 as shown by the arrow in the center-left panel. Right: R dependence of the 12CO(2–1)/13CO(2–1) ratio (black) and of the 28SiO(5–4)/29SiO(5–4) ratio (red).
Current usage metrics show cumulative count of Article Views (full-text article views including HTML views, PDF and ePub downloads, according to the available data) and Abstracts Views on Vision4Press platform.
Data correspond to usage on the plateform after 2015. The current usage metrics is available 48-96 hours after online publication and is updated daily on week days.
Initial download of the metrics may take a while.