Fig. 22
Download original image
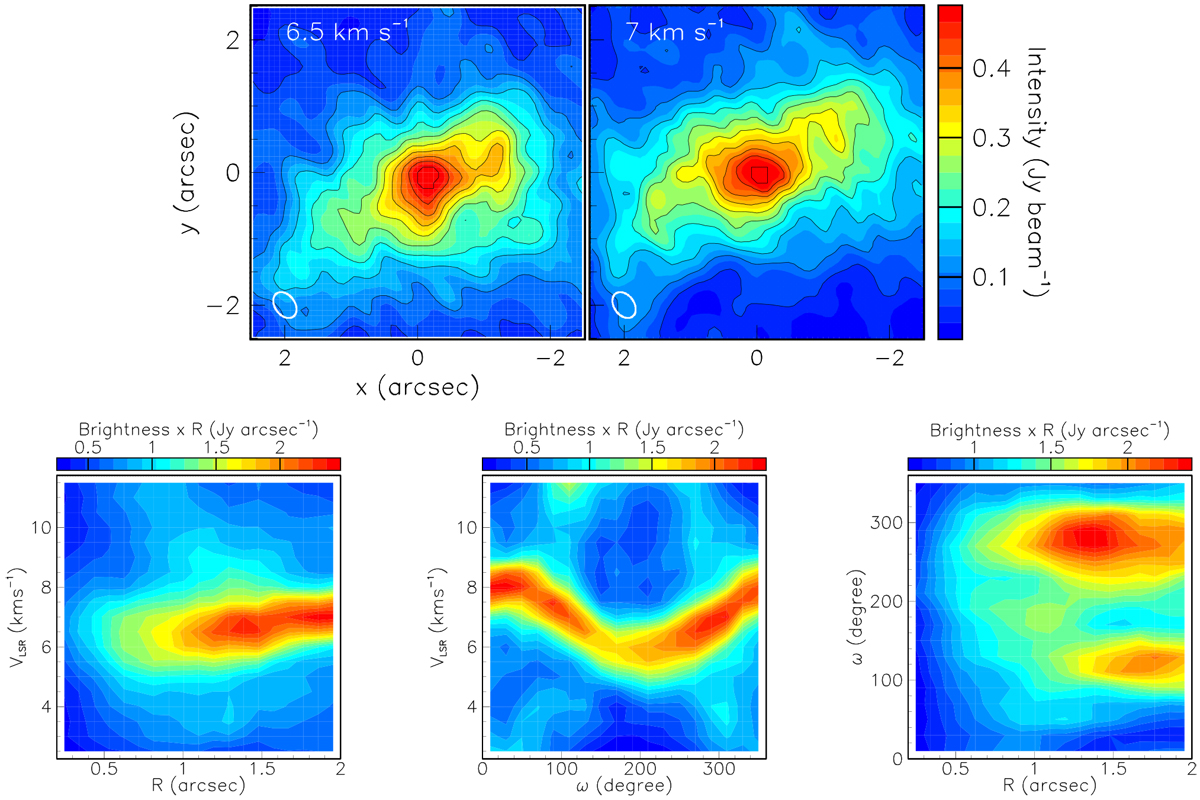
Enhanced 12CO(2–1) emission at vlsr ~ 6.75 km s−1. Upper panels: channel maps of the 12CO(2–1) line emissionbetween 6.25 and 7.25 km s−1. Lower panels: projection of the flux density multiplied by R on the vlsr vs. R plane for 250° < ω <330° (left), on thevlsr vs. ω plane for 0.5 < R < 2 arcsec (middle), and on the ω vs. R plane for 5.75 <vlsr < 7.25 km s−1 (right).
Current usage metrics show cumulative count of Article Views (full-text article views including HTML views, PDF and ePub downloads, according to the available data) and Abstracts Views on Vision4Press platform.
Data correspond to usage on the plateform after 2015. The current usage metrics is available 48-96 hours after online publication and is updated daily on week days.
Initial download of the metrics may take a while.